
The NAFEMS linear elastic benchmarks feature two problems where a plate is subjected to a pressure load. LE1 involves a thin elliptic structure stretched outwards by a pressure force, while LE10 uses the same plate, but thickens it and applies a higher pressure.
LE1 – A Thin Elliptic Membrane
Thin membrane structures are common in many industries, with the aerospace sector being a prime example. These structures are widely used in fuselages, wing surfaces, and engine components. They typically have a high strength-to-weight ratio, making them ideal for balancing the weight of an aircraft with its ability to resist deformation during flight.
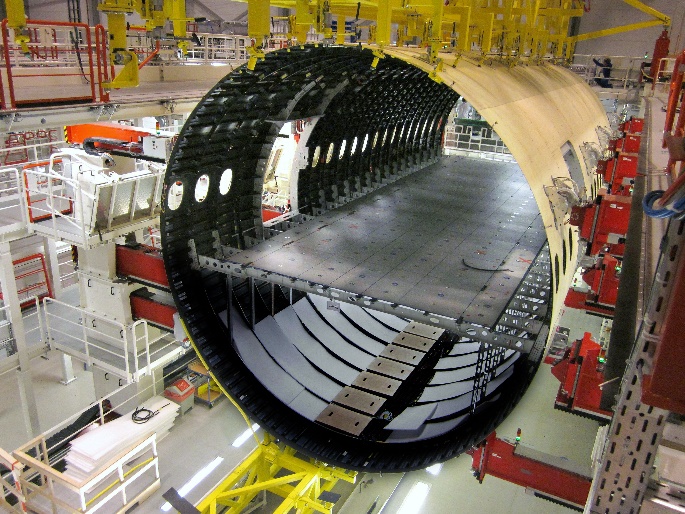
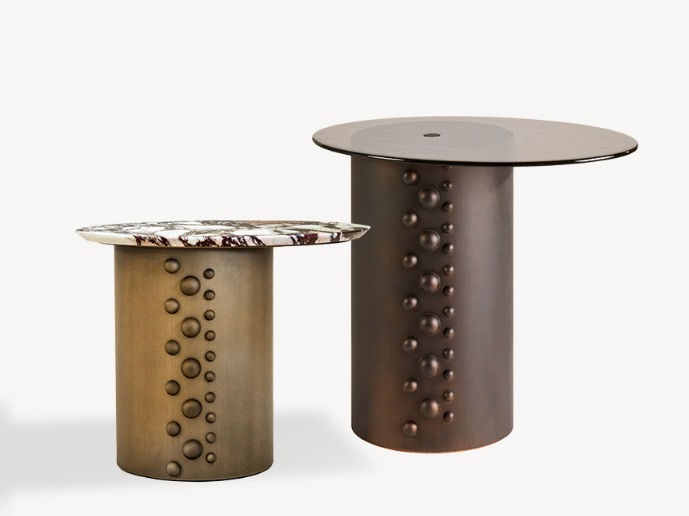
Pictured on the left is an aircraft fuselage (Source: Flug Revue), on the right are side tables with a plate-like top (Source: FBC London)
Thin plates can be challenging to model, especially when they are part of larger structures. They can be sensitive to boundary conditions and are traditionally modelled with shell elements, which can be difficult or complicated to connect to other components. However, with Discovery Explore mode, we model these thin plates with solid elements, allowing us to quickly and easily get results from our geometry without having to worry about whether the underlying assumptions and simplifications of a shell model are valid for our case. The plate can include features such as fillets, holes or varying thickness, all of which can pose challenges for a shell model.
What is this benchmark testing?
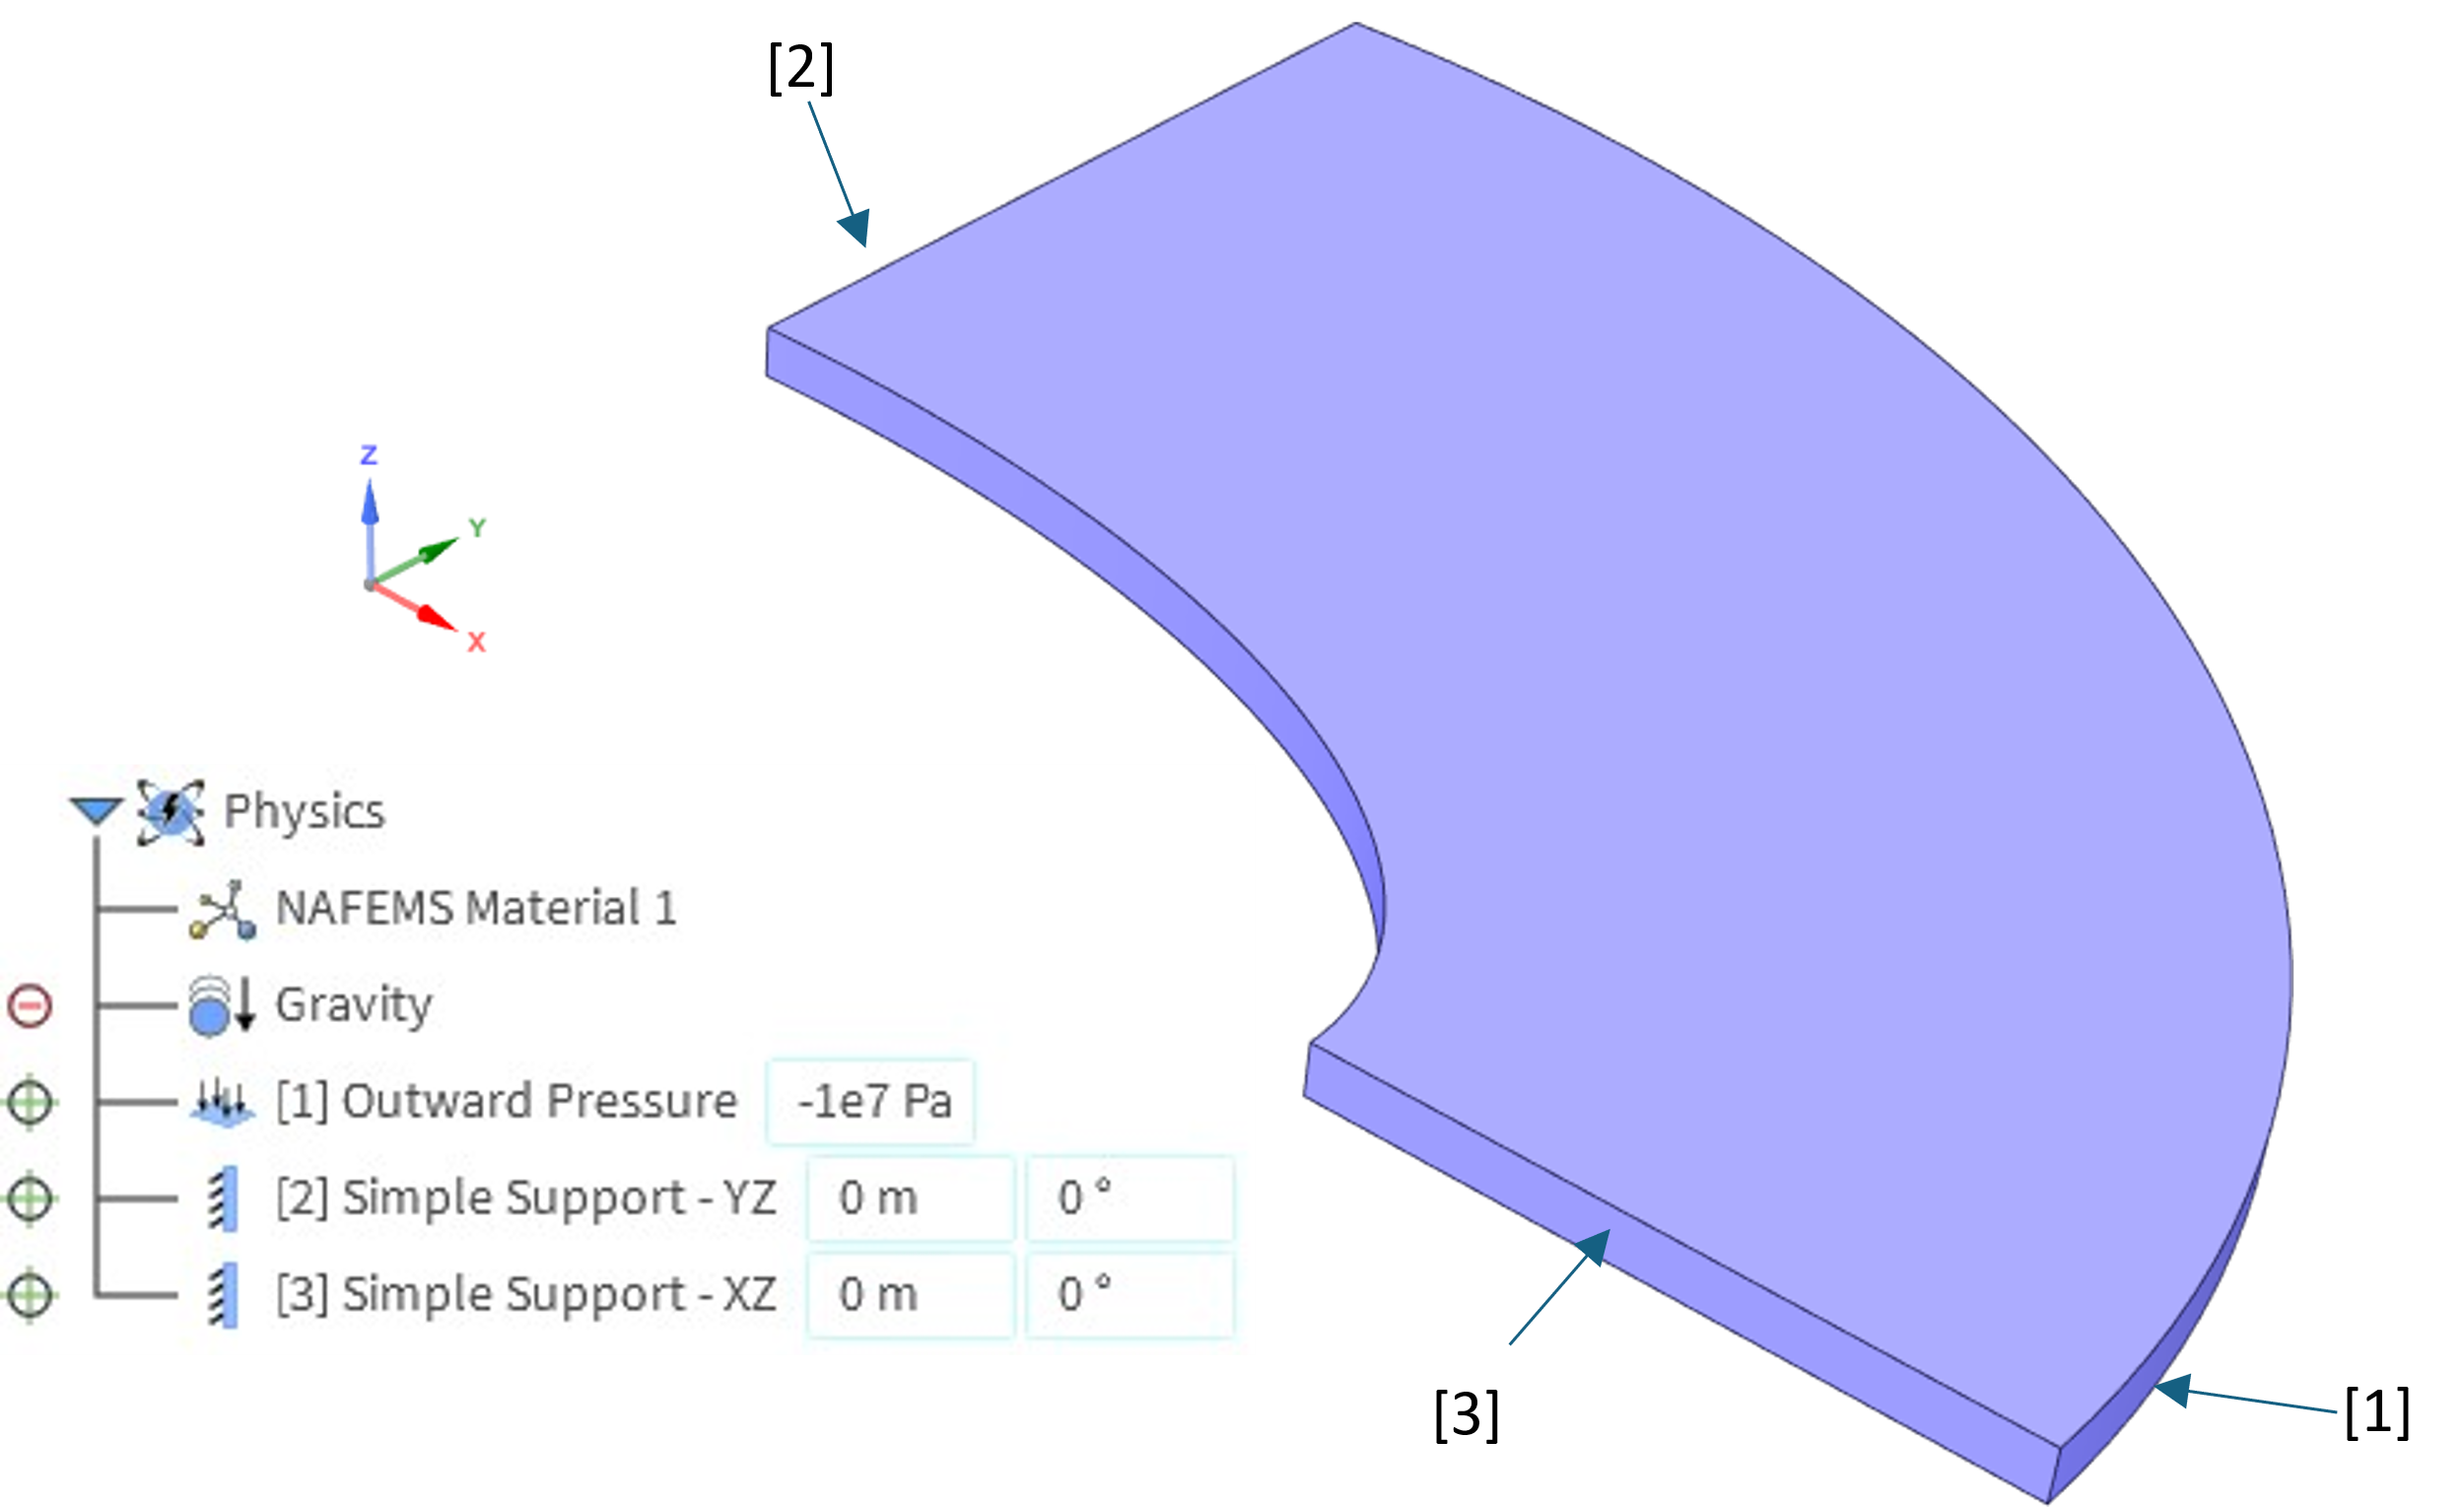
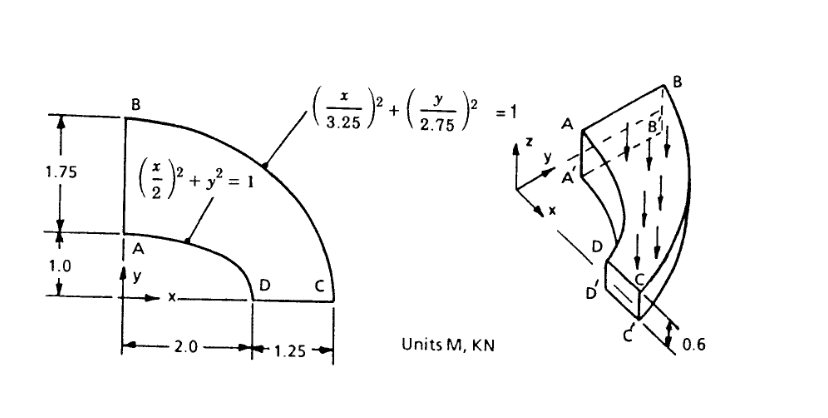
This benchmark investigates the performance of Discovery when analysing thin, curved, membrane-like structures. The NAFEMS LE1 elliptic membrane is 0.1 metres thick and is simply supported at the YZ and ZX planes, as shown in the model schematic below. A uniform pressure of 10 MPa is applied along the outer elliptical surface. The goal of this analysis is to determine the stress at point D acting in the Y direction (σyy) at the midplane, the theoretical result of which is 92.7 MPa.
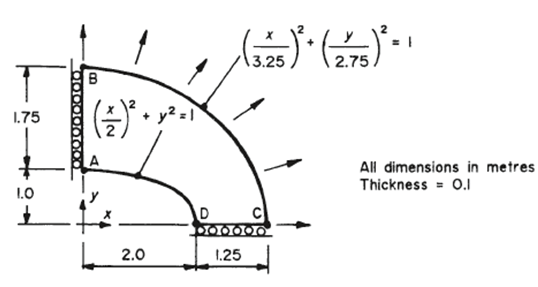
FEA schematic for LE1, taken from The Standard NAFEMS Benchmarks
How are we setting this up in Discovery Explore?
The simply supported boundaries were implemented using displaced support conditions. On the YZ plane, the membrane was fixed for translation in the X direction and rotation about the Z axis. Similarly, for the ZX plane, the membrane was fixed for translation in the Y direction and rotation about the Z axis. Below is the Discovery physics tree, showing the boundary conditions and the surfaces where these boundary conditions are applied.
LE1 Results
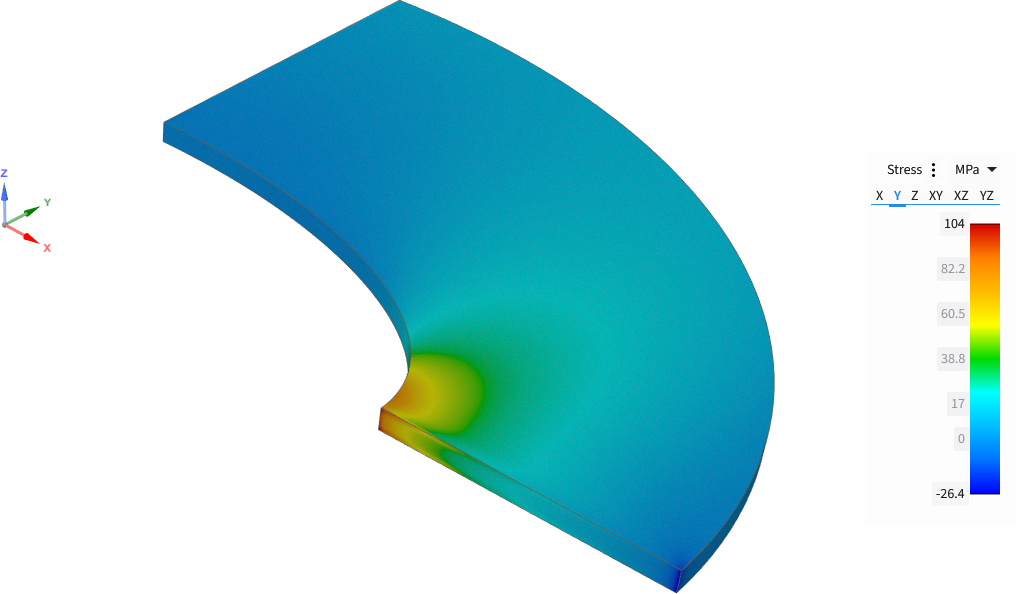
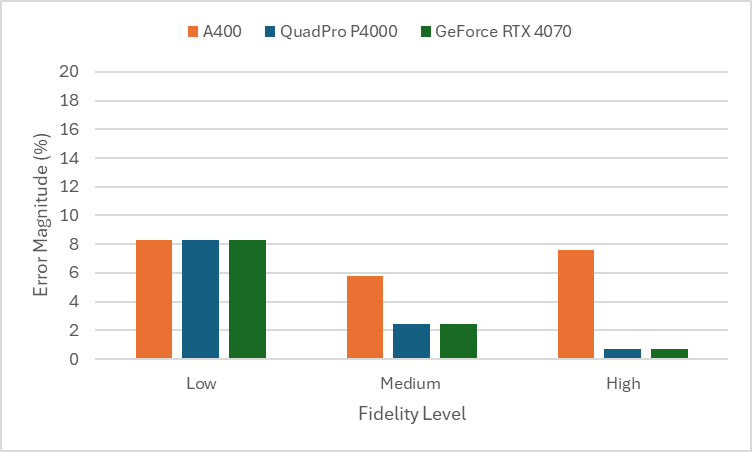
Discovery Explore can accurately predict the stresses for the LE1 benchmark within an error of 0.54% at the highest fidelity when using the GeForce RTX 4070. At low and medium fidelity, the results tended to be slightly underpredicted, with the maximum error at the lowest fidelity reaching approximately 9% on the Quadpro P4000. The σyy stress field is shown below, which was obtained with the GeForce RTX 4070 at the highest fidelity.
LE10 – A Thick Pressure Plate
Thick plates are commonly used in a variety of mechanical structures, especially as webs and flanges of structural members, gusset plates in joints, and within solid frames. To maintain the integrity of the structure, these thick plates must often withstand the various pressures and loads they are subjected to.

Thick plates used in infrastructure (Source: Shutterstock)
Increasing the thickness of plates brings many new challenges in modelling, since both the object and the effects of loading need to be considered in three dimensions. Simplifications like plane stress assumptions no longer apply in these cases. As a result, extra care is required when setting up applying boundary conditions to ensure the simulation is as accurate as possible.
What is this benchmark testing?
The thick pressure plate has the same dimensions as the plate depicted in LE1, but with the thickness increased to 0.6 meters. A uniformly distributed pressure load of 1 MPa is applied to the top surface of the plate.
FEA schematic for LE10, taken from The Standard NAFEMS Benchmarks
Face DCD’C’ is constrained in y – displacement, while face ABA’B’ is constrained in x – displacement. Additionally, face BCB’C’ is fixed in x and y translation with the z – displacement fixed only along the midplane of that face. The target of the benchmark is to achieve a direct stress of 5.38 MPa at corner D.
How are we setting this up in Discovery Explore?
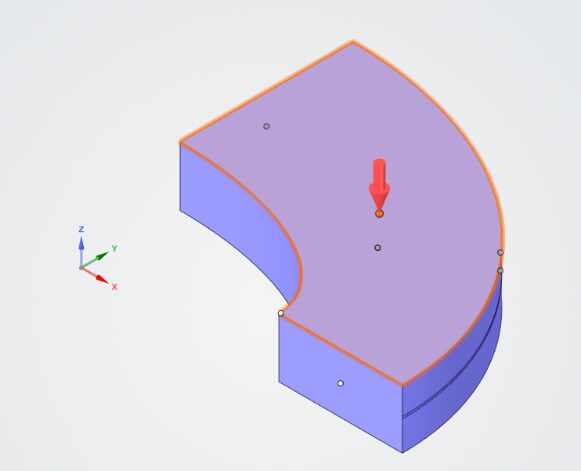
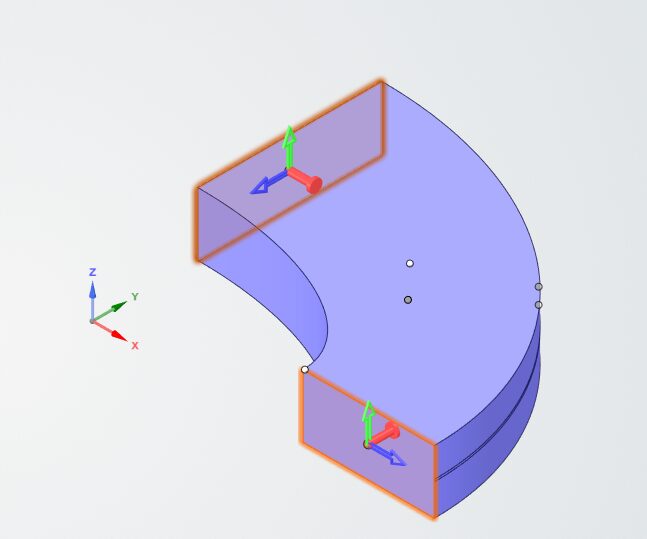
A 1 MPa pressure load was applied to the top surface of the component, followed by the boundary conditions on edges ABA’B’ and DCD’C’.
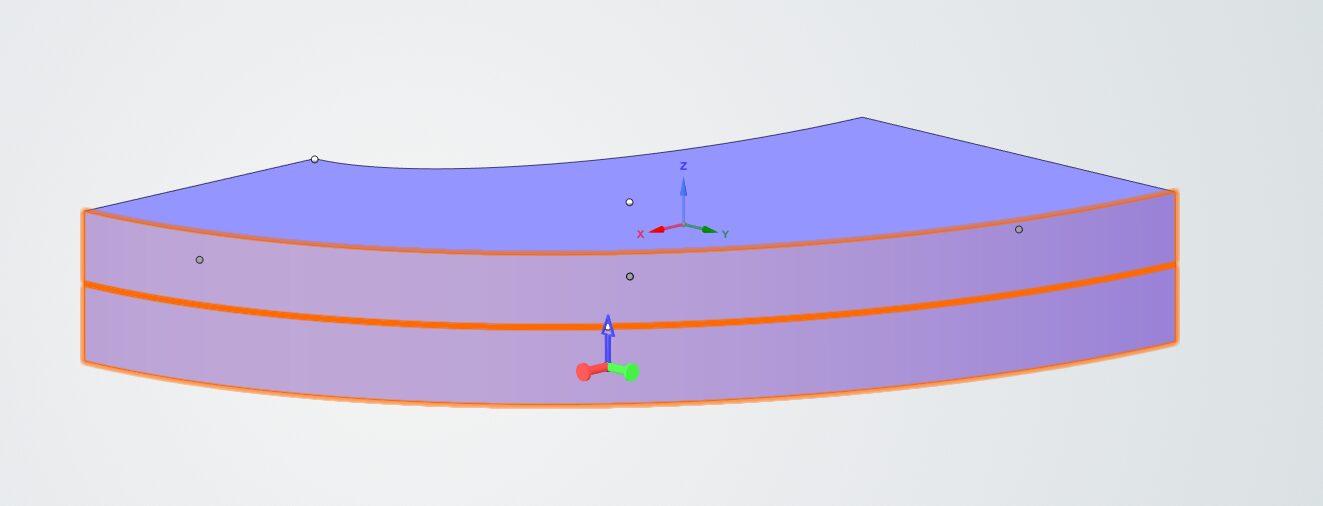
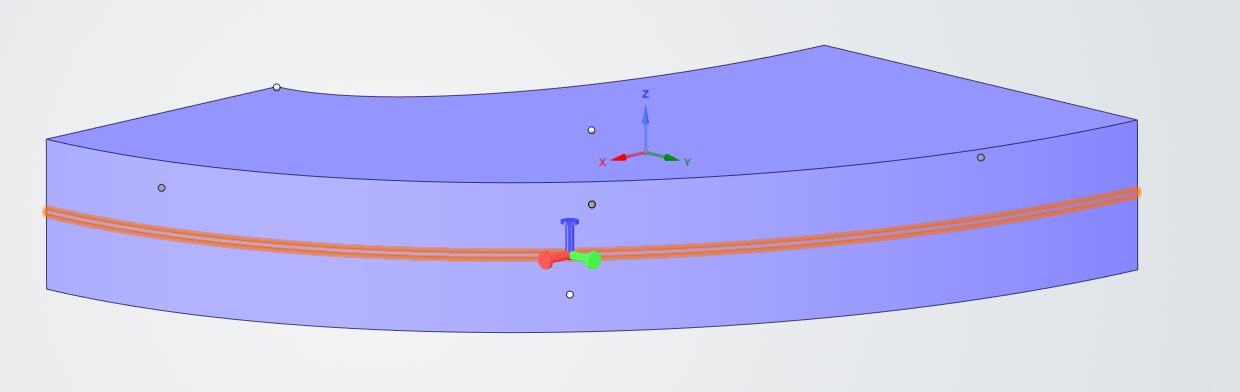
Currently, it is not possible to apply conditions to any midplane or mid surface. To emulate the boundary conditions as close as possible, a small section was added in the middle of the face BCB’C’, splitting it into three parts consisting of two equal sections and a very thin middle section. This enabled separate allocation of boundary conditions on the mid plane from the rest of face BCB’C’.
LE10 Results
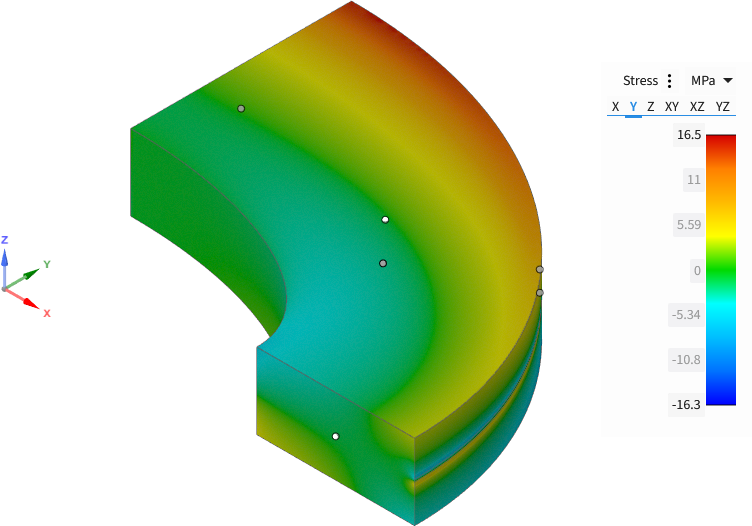
This is the direct stress σyy plot across the plate when it’s subjected to a uniform pressure on the top surface, predicted by Discovery. Since only the side face BCB’C’ is constrained, the other side surfaces can move if influenced by any loading. So, with just a uniform pressure acting in the z direction on the object, the unconstrained areas of the plate are expected to shift accordingly. Compression seen at point D matches the theoretical expectations, showing that Discovery does a great job simulating thick plates.
Below are the percentage differences between the simulation results and the target value.
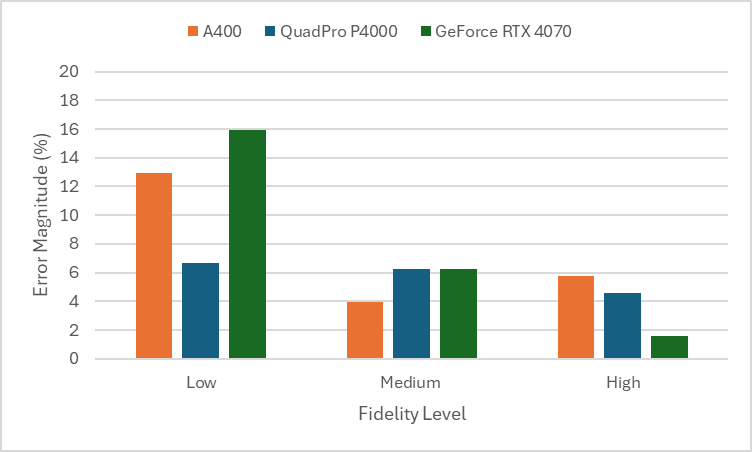
These results further highlight Discovery’s strong performance in modelling this geometry, with the difference between the target value and the computed value staying under 10% at the medium fidelity level.
More in this series:
NAFEMS Discovery Benchmark Series – Part 1: Introduction
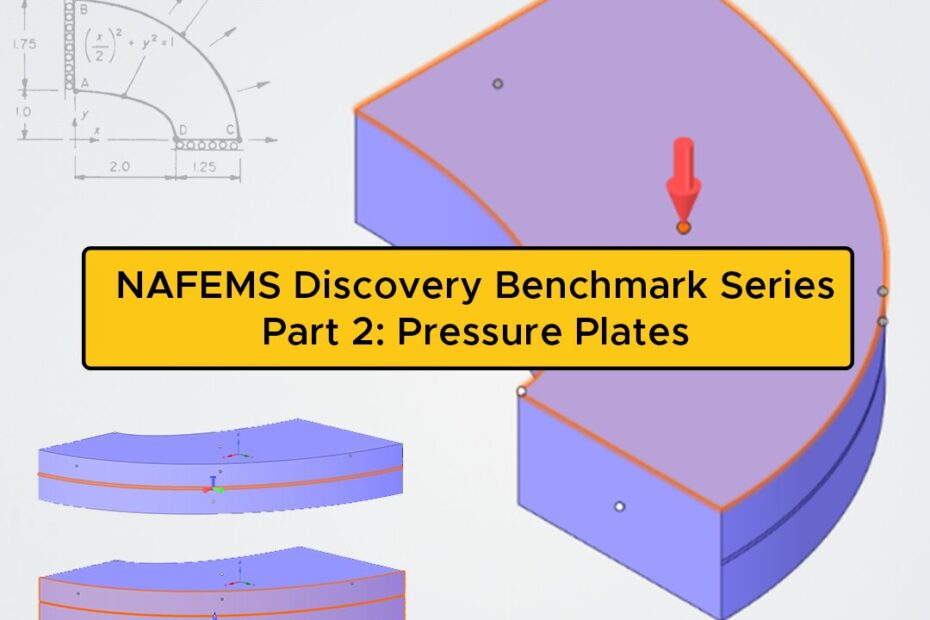
NAFEMS Discovery Benchmark Series – Part 2: Pressure Plates
NAFEMS Discovery Benchmark Series – Part 3: Simple Geometries (Coming Soon)
NAFEMS Discovery Benchmark Series – Part 4: Axisymmetric Geometries (Coming Soon)
NAFEMS Discovery Benchmark Series – Part 5: Discovery Scripting (Coming Soon)