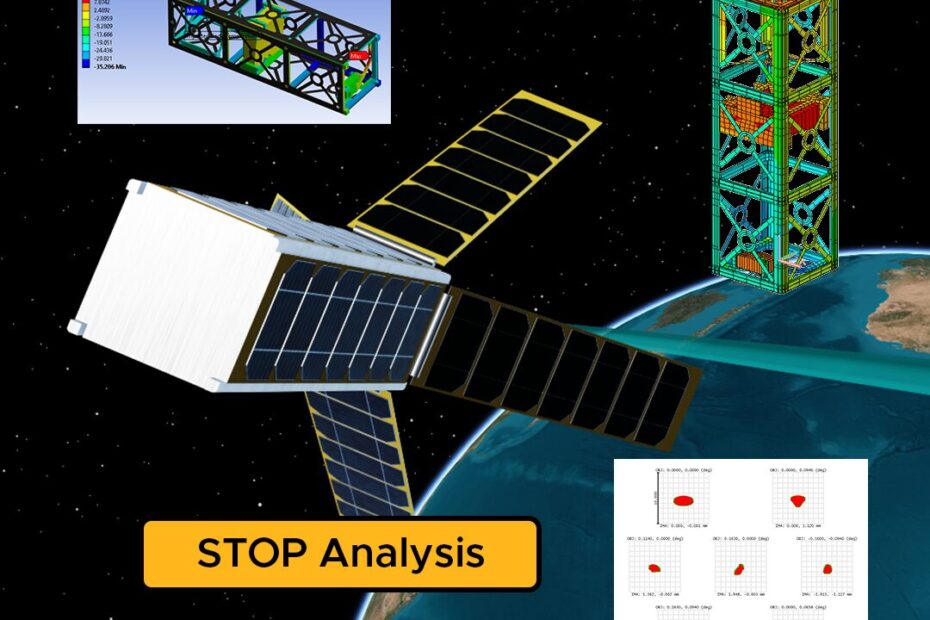
What is a STOP Analysis?
Structural Thermal Optical Performance (STOP) Analysis is a critical design assessment for the development of optical payloads, particularly amongst high performing systems and for systems to be deployed in harsh environments. Nowhere is this more applicable than for an optical payload for space-based observations. Often this requires incredibly specialised optical equipment, placed in one the harshest environments known to humans, and required to function flawlessly or else risk an entire satellite becoming defunct.

At its core, a STOP analysis is an assessment of how the structural and thermal loads on an optical payload will affect the system’s end performance. Ultimately, how very small deformations in the housing, lens or mirrors of such a payload can have critical impacts on the end image produced, and in turn, the overall mission success.

Why do a STOP Analysis?
Outside of the Space industry, STOP analysis is commonly seen across everything from cell phone camera manufacturing to laser manufacturing and aero-optics work. Across all these industries, STOP analysis provides stakeholders with the confidence that their optical payload is capable of withstanding and performing the operating conditions it will be exposed to in the real world.
This is particularly true with the space industry, where a whole array of “what if” questions exist. In turn, ensuring a payload is fit for purpose before launch day rolls around is of utmost importance to the overall mission and its success.
Traditionally, STOP analysis can be seen as a time consuming and challenging process, as it requires inter-disciplinary collaboration between various subject matter experts, as well as different design and simulation tools. However, with the right tools and a streamlined workflow this process can be massively accelerated, whilst also enabling newfound optimisation and design flexibility.
STOP Analysis of a LEO Satellite Payload
With this particular STOP Analysis example, we’ll explore a relatively simple payload aboard a Low Earth Orbit (LEO) satellite. The payload itself is based on one aboard a real 3U cube satellite and utilises two rectangular, hyperbolic mirrors [1]. Note, the simulated payload that follows throughout this analysis is indicative only. It does not represent the actual specifications or performance of the aforementioned payload and satellite.
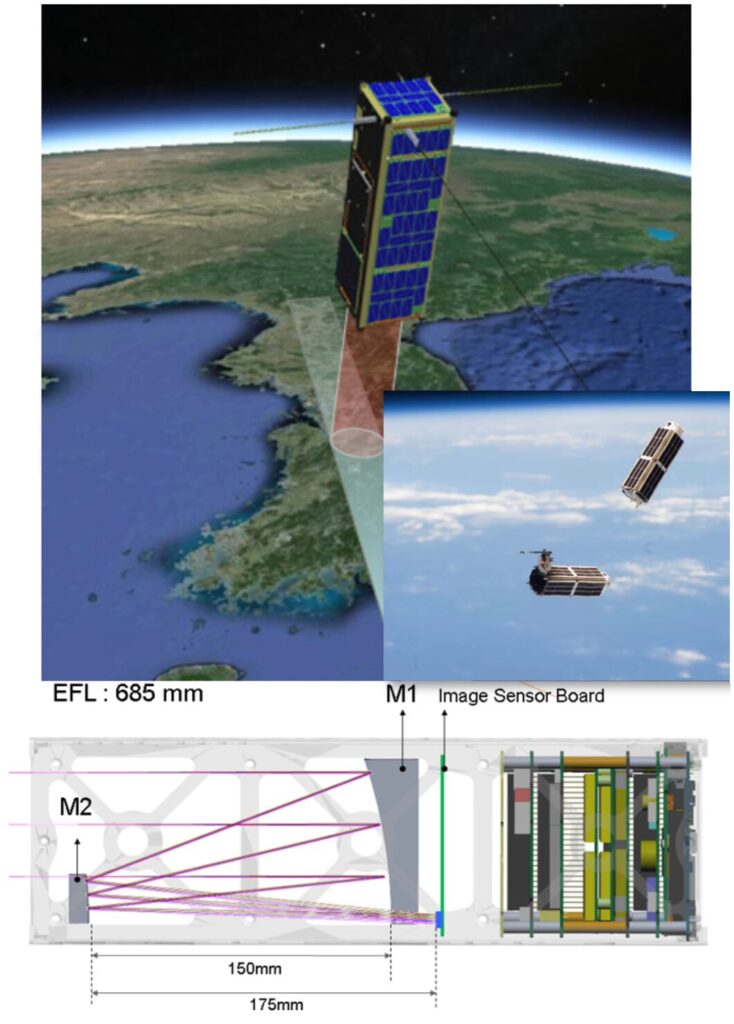
3U Cube Satellite and optical payload off which the following STOP analysis is loosely based, H. Jin et al [1]. The actual payload designed and simulated throughout this STOP analysis is purely indicative of a typical payload and does not reflect the above payload’s actual specifications or performance.
The payload is designed to image in the visible spectrum and must fit within the 3U cube satellite form factor. These design requirements are conditions that will be imposed on any optimisation studies we might run during the STOP analysis, thus ensuring our payload conforms to the imposed mission requirements.
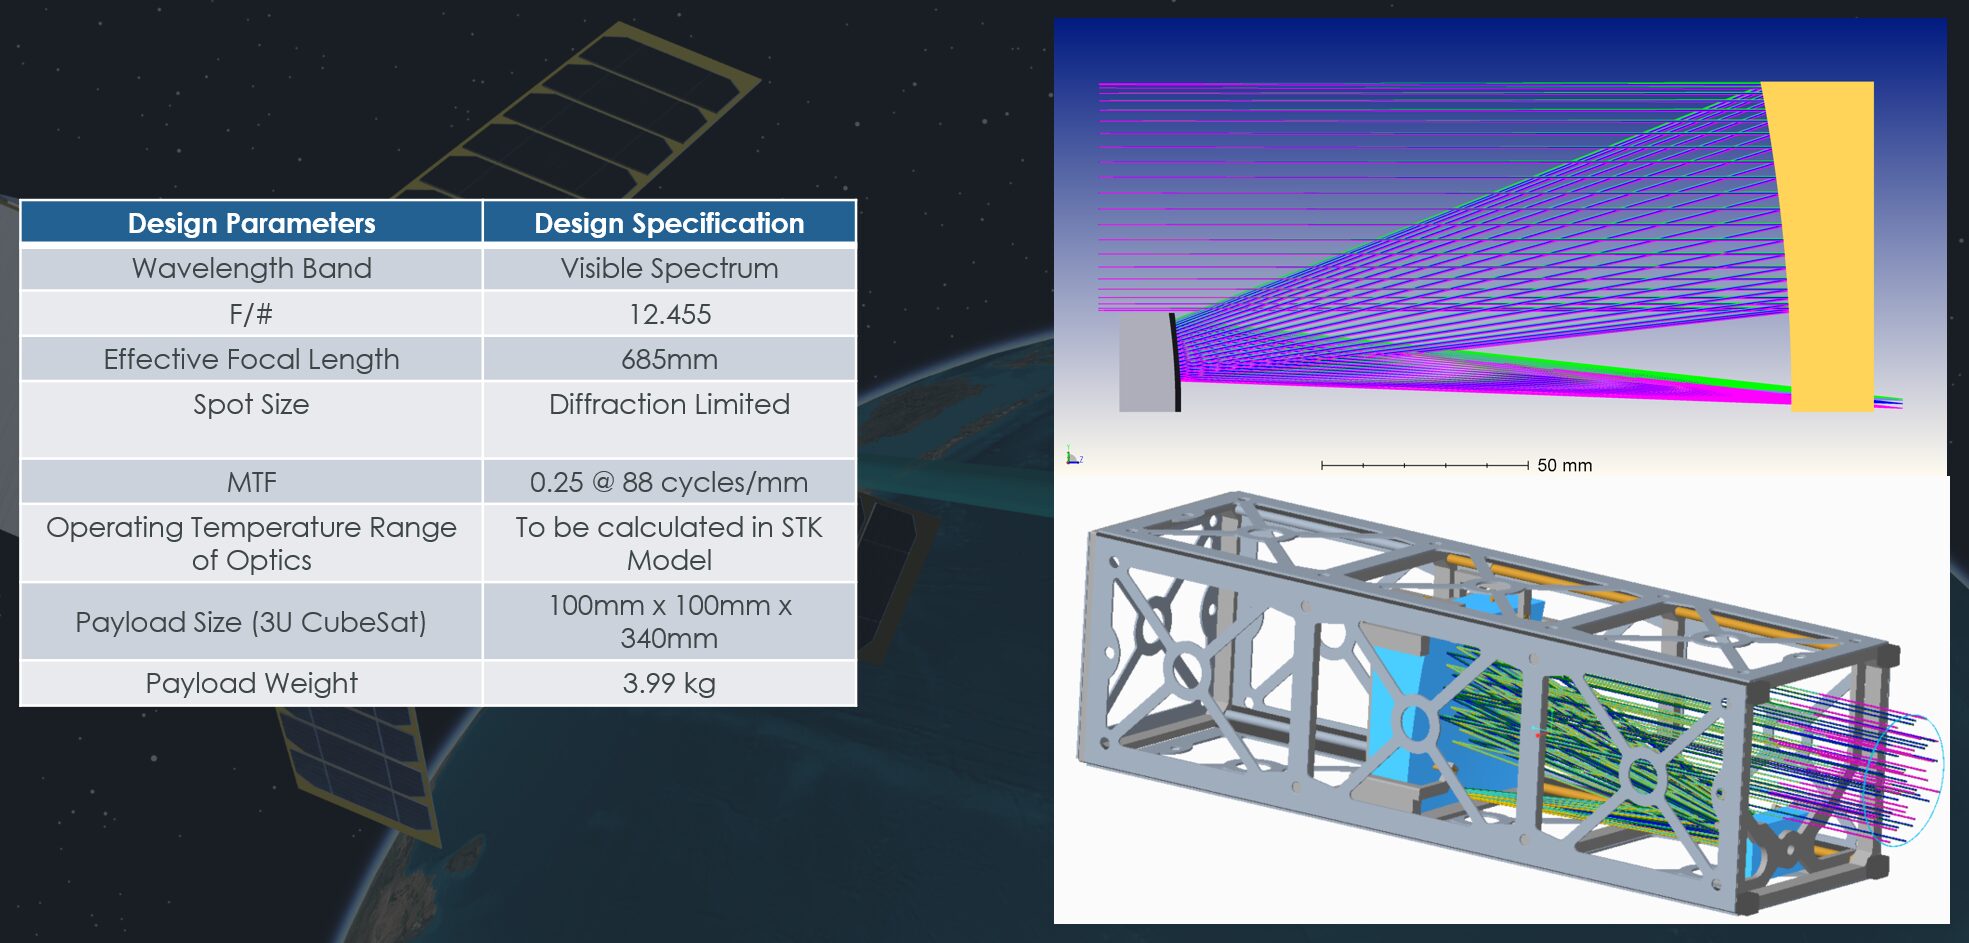
For the mission itself, the LEO satellite will align itself with either Sydney or Perth each orbital pass, allowing the imaging payload to perform its observations. In particular, we’ll be interested in images taken during nighttime passes. The particular drive behind these observations could range from environmental research to national security concerns or more. In our case we will eventually introduce some new, hypothetical, bushfires to the scene and assess the system’s effectiveness at detecting these new entities.
LEO Satellite visualised in Ansys STK, aligning itself with Perth during a nighttime pass.
Establishing a baseline Ideal Case
In order to understand the optical payload performance after the STOP analysis, an ideal case baseline must first be established. To simulate such a scene, Ansys System Tool Kit (STK) has been used to simulate the LEO Satellite and imaging payload as it passes over Perth and Sydney. For the ground targets, a publicly available Radiance texture map has been sourced from NASA’s Earth Data database [2], providing nighttime radiance data for the cities and their surrounds.
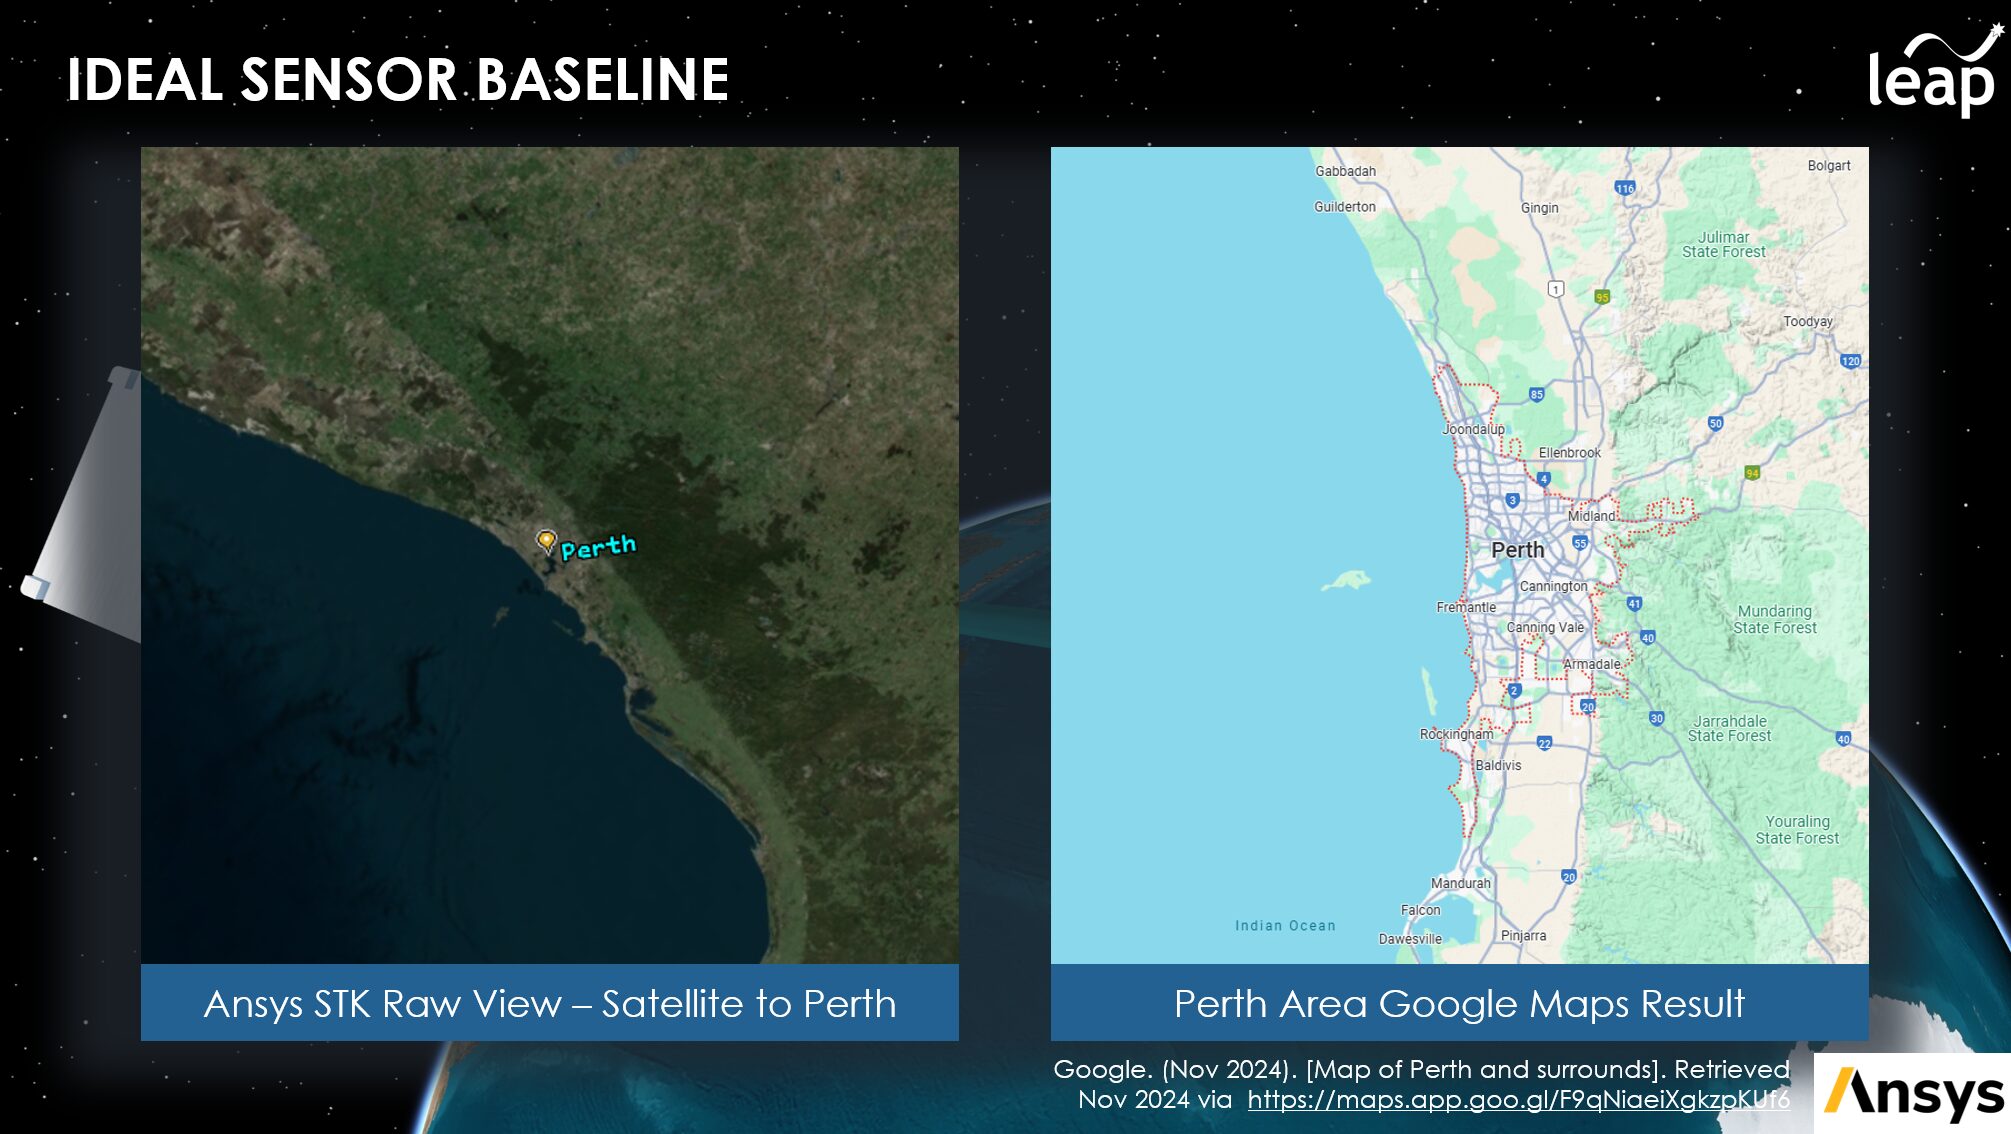
Raw view in Ansys STK from satellite to ground target (left) and equivalent area capture in Google Maps [2].
In this case, radiance data has been employed as it was the most readily available data type, however, temperature, emissivity, and reflectance data can also be used to define Earth texture maps within STK.
To simulate the image the sensor would see in this scenario, STK’s Electro-optical Infra-red (EOIR) Synthetic Scene Generation tool is employed. This tool takes into account the spatial, spectral, optical and radiometric properties of the sensor, target and any atmospheric model employed, to generate a physics-accurate view of what our sensor would see if it were launched tomorrow, and we were to download an image from a pass over either city target.
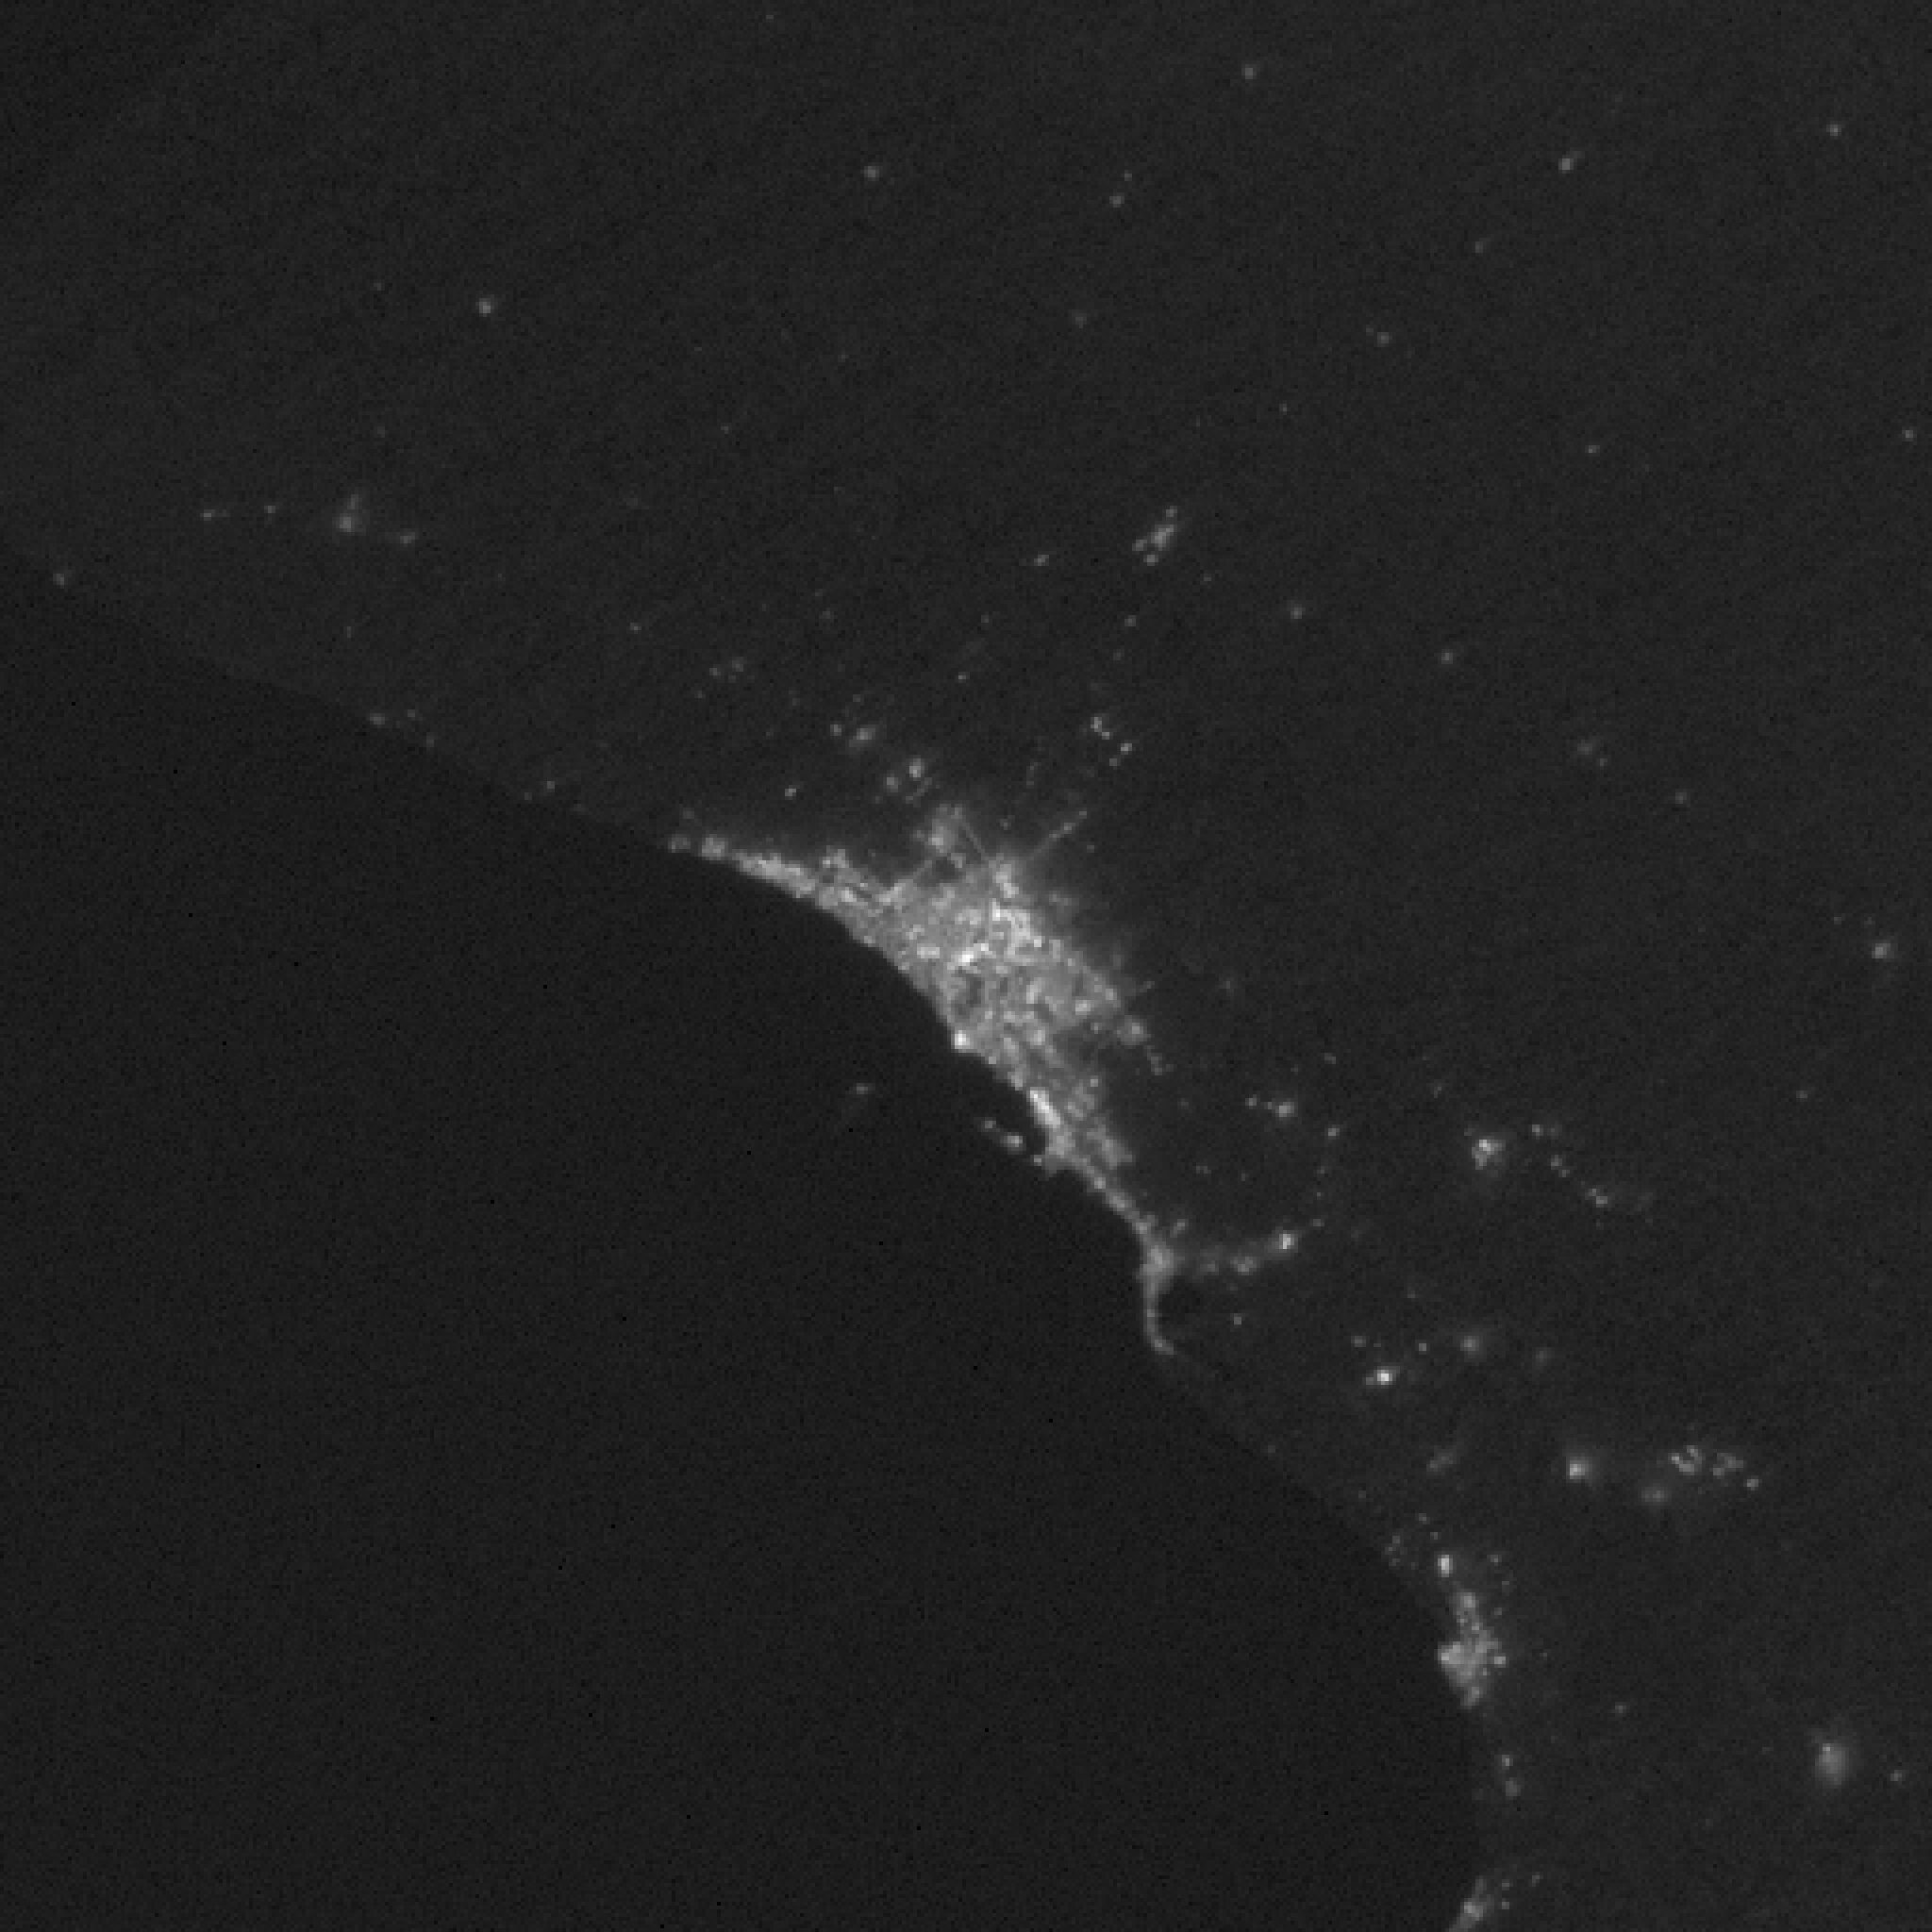
Full simulated EOIR result for sensor imaging Perth during the night
For the Perth example, we can make out a number of distinct targets within Perth and the surrounding area. This includes the infrastructure on Rottnest Island, the Swan River, and the Great Eastern Highway extending eastwards from the Perth surrounds.

Similarly, the Sydney scenario shows the Wollongong CBD as a noticeable bright spot, the highway through the Blue Mountains and various suburbs along that line, as well as the dark area of Botany Bay.

In this particular example, we have omitted an atmospheric model from the simulation, as our main interest lies in assessing the payload performance on the provided Earth Observation targets. However, STK supports an inbuilt “simple” atmospheric model, as well as a MODTRAN atmospheric model as two inbuilt methods to increase simulation fidelity where needed.
Crucially, we can also assess our sensor performance in a more analytical fashion via a Spot Size Diagram. This result has been computed in Ansys Zemax, part of the Ansys Optics suite of software, and allows us another means with which to assess the payload performance. In a simplified sense, the smaller the red dots are in the image below, the more in focus we can expect our end image to be. Similarly, the less stretched or elongated the dots are, the less visual aberrations we can expect in the end image. This computed result will provide another valuable point of comparison between our ideal baseline and our upcoming STOP analysis results.
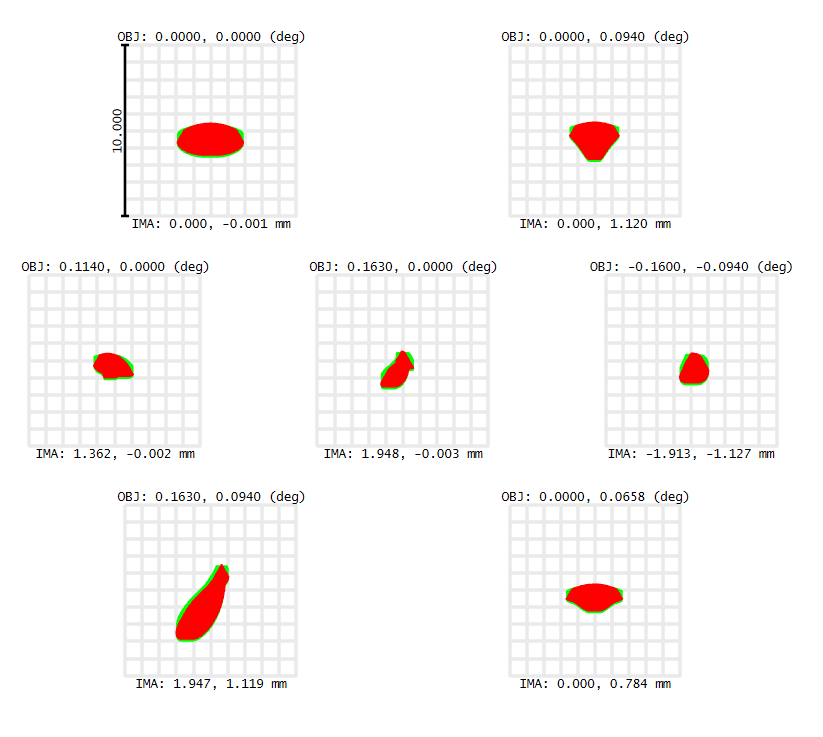
Spot Size Diagram computed in Ansys Zemax. Average RMS Spot Size = 0.83um.
With an ideal case established, we can now step through the STOP analysis, accounting for the real environment our satellite will need to endure and assessing the impact of the structural and thermal loads on the end image quality.

Typical Stop Analysis Structure

Goal of the STOP analysis is to compute and compare the sensor performance after the structural and thermal loads of its true operating environment have been taken into account.
Defining the operating environment.
The first step in our STOP analysis is to define the operating environment of our payload. In this case that consists of a LEO satellite simulated in Ansys STK. This initial simulation provides the accurate orbital position and orientation data necessary for the subsequent thermal analysis.

In this case, the attitude profile of the satellite is relatively straightforward, aligning itself with the ground target each orbital pass. However, should the satellite have multiple ground targets, potentially lingering on each for various periods of time depending on user uploaded commands or the time since the last successful imaging window, then this attitude information could be similarly extracted for the subsequent analysis. In doing so, the orbital model is easily scalable and adaptable to changing mission requirements, integrating seamlessly with the subsequent analysis steps.
Thermal Analysis
Next, the orbital position and attitude information is provided to the chosen thermal analysis software as boundary conditions. In this instance, our example STOP analysis utilises Ansys Thermal Desktop due to its strong pairing with STK, and ability to very effectively solve transient system-level thermal analysis across large system models. This is primarily facilitated by Thermal Desktop’s capabilities for “mixed fidelity modelling” in which full 3D meshed geometry, simplified 2D shapes, and even 0D node networks can be combined within the same thermal model. This approach allows for simplification of simple geometric areas, whilst retaining the required detail in areas of complex or novel geometry to attain an accurate solution.

Thermal Analysis in Ansys Thermal Desktop allows for the rapid and accurate computation of Thermal loads across the satellite payload and overall structure.
Ultimately, the Thermal Analysis step allows us to account for the material composition and structural design of the satellite and its optical payload. The goal here is to calculate the thermal load on the payload, with particular attention to periods of peak load. Time instances with either the max or min temperature, or the strongest thermal gradients, will likely be when the most significant structural deformations occur.
It’s worth noting that this thermal analysis models both the payload and the surrounding satellite structure. In many implementations this may not be necessary, as the payload will be mounted in a manner that effectively thermally isolates it from the remainder of the satellite. In this case, the thermal analysis could be further accelerated by simulating only the optical payload, provided that sufficient design and testing work has been done to ensure the payload can be treated as independent from the remainder of the satellite.
Structural Analysis
With the thermal analysis complete we can map the thermal results onto a structural Finite Element Analysis (FEA) mesh. Using Ansys Mechanical, the structural deformation of both the overall satellite frame and, crucially, the mirrors in the optical payload can be computed. Often, these deformations are going to be invisible to the human eye, but even a small deformation can have a major impact on end image quality.


Thermal Analysis performed in Ansys Mechanical using a generated Finite Element Analysis Mesh
Beyond the static structural deformation, this step in the process can also assess any dynamic structural loads on the payload. For example, our hypothetical mission has the satellite aligning itself with a ground target each orbital pass. Suppose the satellite were achieving this alignment with a series of reaction wheels aboard the structure. The motion of these wheels during the imaging sequence is likely to induce some form of vibration or jitter on the imaging payload. Similarly, any slower frequency vibrations from satellite components, such as deployed solar panels, can add further dynamic effects to the optical payload. If the optical payload is not isolated effectively from these dynamic effects, these high and low frequency oscillations can impose undesirable dynamic effects on the optical payload, and in turn degrade the clarity of the image produced. Whilst this mechanical jitter is not something we have explicitly modelled in this simulation, it is possible to implement this across a range of fidelities within this STOP analysis. In its simplest implementation, an approximated jitter can be imposed directly in Ansys STK’s EOIR tools. For more complex implementations an external reference file calculated in a tool such as Ansys Mechanical can be provided to STK, allowing for incredibly in-depth, manoeuvre specific jitter to be factored into the end image quality.
Optical Analysis
Next, the analysis returns to Ansys Zemax for the optics analysis. This process mirrors the analysis performed to derive the initial spot size diagram pre-STOP analysis, however the geometry is now updated to reflect the deformed state of the optical payload.
In turn, the following spot size diagram is computed. Immediately, this presents a clear difference to the earlier diagram. Each spot has grown significantly in size, from an initial average RMS (Root Mean Square) spot size of approx. 1µm to almost 15µm in the latest analysis.
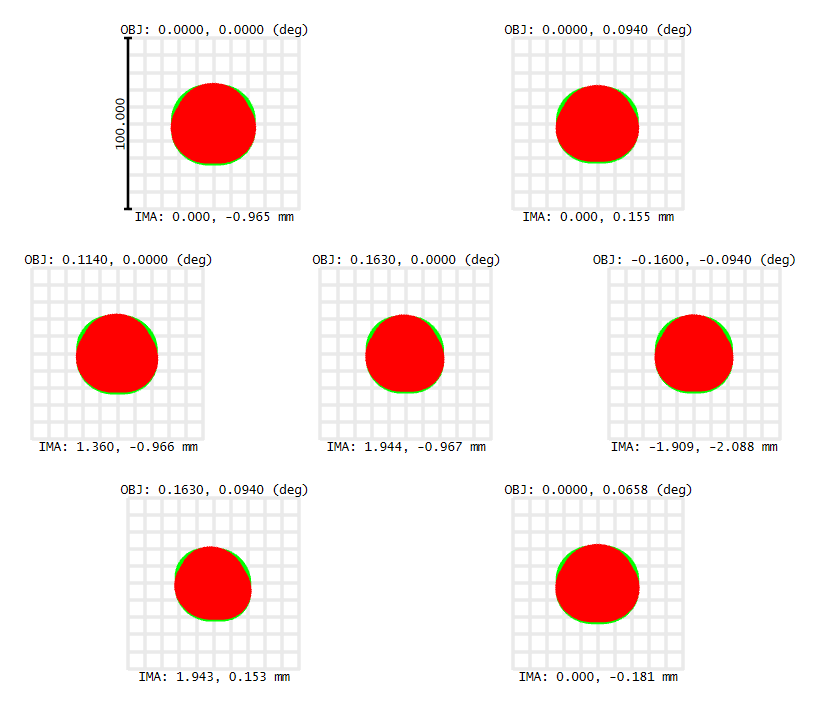
Newly computed spot size diagram shows significant growth in average RMS Spot Size from <1um to almost 15 um.
This suggests the optical performance of the payload may not match initial expectations, and in turn mission requirements. However, for anyone viewing these results who is not familiar with optical analysis and spot size diagrams, the computed result may be difficult to fully grasp. Thus, it’s crucial that this information can also be presented in a more broadly recognisable and intuitive manner.
Real World Performance
To visualise the newly computed optical performance, we simply need to adjust the sensor definition in Ansys STK using the latest Ansys Zemax output file. Doing so allows us to immediately visualise and assess the impact of the STOP analysis on actual image quality. Below, the image compares the before and after STOP analysis images.

Perth Before and After STOP Analysis Simulation
Clearly, the level at which small details can be resolved in the right-hand image is significantly reduced. With the post-STOP analysis image most, if not all, of the distinguishable features from earlier have become lost to the blurred glow of the Perth and Sydney surrounds.

Sydney Before and After STOP Analysis Simulation
This step in the process represents a critical tipping point. We have now established a process with which we can confidently assess whether our system is sufficiently designed for the mission at hand. If the right-hand side images are clear enough for our imaging goals, and the thermal/structural loads we’ve assess in this particular case represent the worst-case scenario the satellite will face, then its possible our satellite and payload is adequately designed.
However, if the right-hand side images are not sufficient for our requirements, then we have now developed the workflow necessary to go back in the design process, explore potential changes, and immediately assess the effect on both initial baseline performance, as well as the post-STOP analysis, real-world performance.
What now? Design optimisation, changing mission requirements, etc
Earlier, the STOP analysis process was visualised as a linear process. In reality, this can be thought of more so as a circular and iterative process. With the workflow created above, we have now created a complete digital thread, capturing possible design choices throughout the entire system design to assess end performance. In turn, we are now in a position to go back through the design process, explore potential changes and rapidly assess and compare end system performance.

Workflow can be thought of as a circular and iterative process, allowing the user to rapidly change design choices anywhere in the process and immediately assess impact on initial idea-case and post-STOP Analysis performance.
Possible changes could include different material compositions, optimised lens configurations or entirely new satellite orbits. However, the digital thread established also facilitates the rapid digital prototyping and testing of the mission on a much higher level.
Suppose this payload was being developed for a particular client, and that client’s requirements were to suddenly change. Suddenly, the project needs to pivot as the payload is now required to be mounted to an aircraft rather than satellite, it needs to image the infrared spectrum rather than the visible, and the size constraints of the payload have changed significantly.

Not only are all of these changes now possible, but the very solution to get us there is already streamlined for us.
Similarly, the STOP analysis so far has been a manual process. In a lot of instances, we may look to automate this process with some scripting. Doing so would allow us to implement optimisation studies, efficiently exploring both valid and optimal design points within broad sweeps across multiple design variables.
Further, by automating the STOP analysis process we’ve laid the groundwork for generating a library of tens of thousands of EOIR images. This library can explore any number of target, sensor, background noise combinations, etc. Put together, this represents the perfect library for training an in-house AI/ML model, as the truth data behind every single image exists within the simulated mission.
For example, if training an AI model to detect whether a bushfire is or isn’t present in an Earth Observation image, the simulation used to generate a library of EOIR images from various orientations, sensors, pre- and post-STOP analysis lens configurations, also contains the truth data as to whether a fire is or isn’t present, its exact size, location, temperature, etc. Similarly, if training an AI model to identify aircraft, the truth data behind a synthetic image library would contain information such as whether the aircraft is indeed present, its altitude, orientation, material properties, type of aircraft, etc. Crucially, these libraries, as well as the automated training and feedback process, can be generated much faster than any single operator with a manual workflow following this process.
Ultimately, the digital thread defined with this simulation, and the ability to rapidly simulate and assess complex system performance enables significant time savings, reduced risk and increased confidence in the end solution for all project stakeholders.
What next?
There is an argument to be had, that with this initial STOP analysis we are simply simulating real-world results that already exist. While there are many distinct merits to this analysis, utilising an existing texture map from a real-world satellite isn’t necessarily simulating anything new.
However, the previous STOP analysis lays the groundwork for us to explore new “what if” scenarios. What if a new bushfire starts in the area surrounding our ground target? Is our sensor going to be able to detect it before and after the STOP analysis is accounted for?

New Bushfire modelled in the hills behind Perth. 3D terrain data steamed into Ansys STK for improved visualisation [5]. How large or bright does this fire need to be for reliable detection by the current sensor?
Join us in part two of this STOP analysis, where we’ll build on the existing scenario, exploring new hypothetical cases to truly test our system performance.
References
|
[1] |
K. L. Y. K. a. S. H. Jin, “Optical Design of a Reflecting Telescope for a CubeSat,” Journal of the Optical Society of Korea, vol. 17, no. 6, pp. 533-537, 2013. |
|
[2] |
Google, “Map of Perth and surrounds,” November 2024. [Online]. Available: https://maps.app.goo.gl/F9qNiaeiXgkzpKUf6 . [Accessed November 2024]. |
|
[3] |
Google, “Map of Sydney and Surrounds,” November 2024. [Online]. Available: https://maps.app.goo.gl/vGqefa5J2SAFA6Kv5 . [Accessed November 2024]. |
|
[4] |
A. Inc, “Simulating Realistic Optical Performance of a Low Earth Orbit Satellite,” 2023. |
|
[5] |
Google, Data SIO, NOAA, U.S. Navy, NGA, GEBCO, Landsat/Copernicus, IBCAO, U.S. Geological Survey, “3D Terrain Data,” 2024. [Online]. [Accessed November 2024]. |
|
[6] |
NASA, “VIIRS/NPP Gap-Filled Lunar BRDF-Adjusted Nighttime Lights Daily L3 Global 500m Linear Lat Lon Grid [Dataset],” 2019. [Online]. Available: https://doi.org/10.5067/VIIRS/VNP46A2.001. [Accessed December 2024]. |

