
Previously…
Previously, this DME Blog explored the STOP analysis of an Earth observation payload aboard a LEO (Low Earth Orbit) satellite. Using a variety of digital simulation tools the process allowed us to both visually and analytically compare sensor performance and image quality before and after the STOP analysis for a given mission.
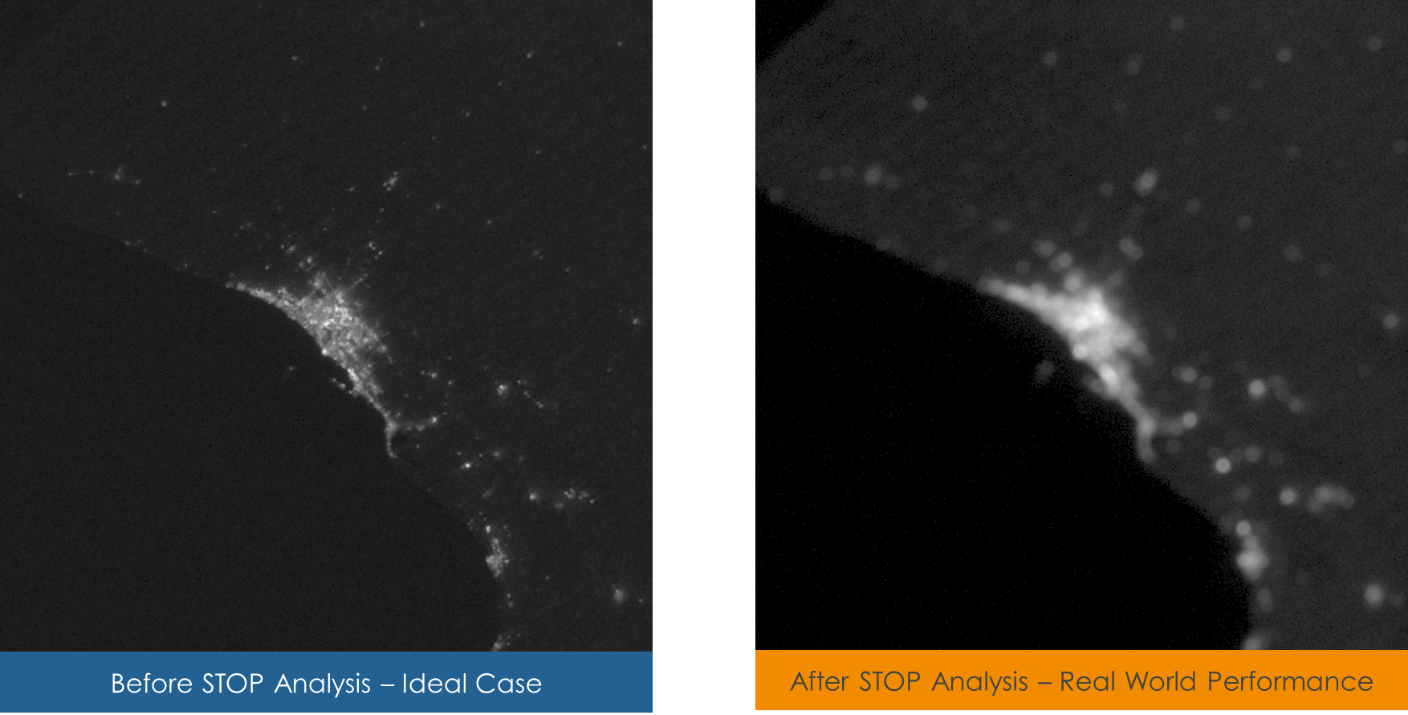
Perth Before and After STOP Analysis Simulation
However, the scenario utilised existing ground texture maps, produced by real-world satellites as the only imaging target. In this instalment, we’ll expand on this simulation, adding new hypothetical elements to the scene with the goal of assessing the ability of the payload to reliably detect these new elements.
New Hypothetical Scenario
In particular, we’ll explore a number of hypothetical bushfires in the hills behind Perth. A common application for EO imagery from LEO lies in the detection and tracking of bushfires, particularly with larger LEO constellations providing shorter revisit times over a given area of land.
For our hypothetical bushfires, these will be modelled as uniform point sources near Perth. As with many other parts of this simulation, a spectrum of fidelity and detail exists when choosing the ideal simulation path. In this case, a relatively simple implementation will facilitate the rapid evaluation of the system performance.
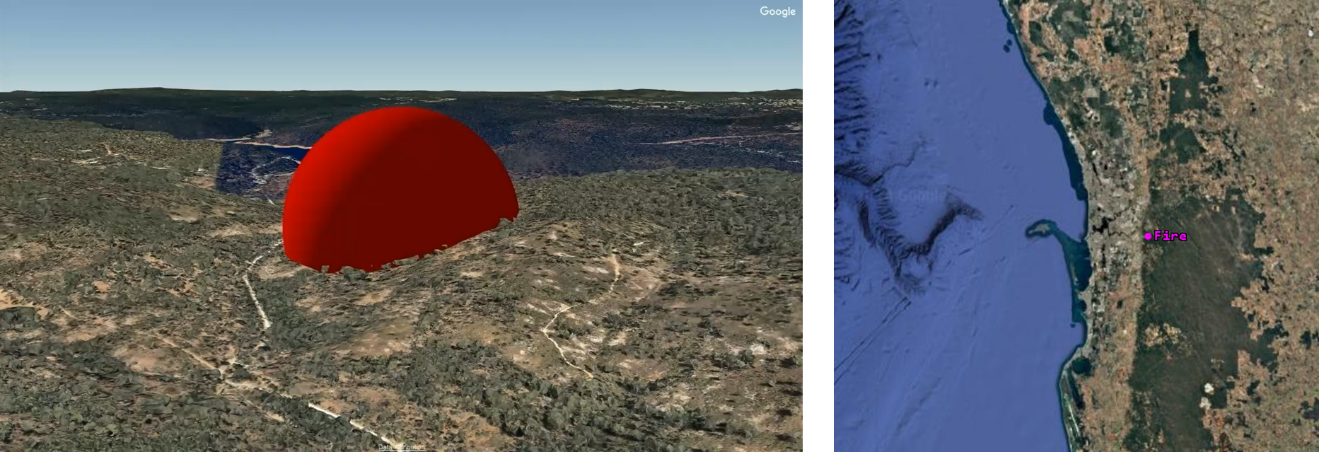
New Bushfire modelled in the hills behind Perth. 3D terrain data steamed into Ansys STK for improved visualisation [5]. How large or bright does this fire need to be for reliable detection by the current sensor?
The bushfires will be a constant size and temperature, with a uniform spherical shape. However, it’s worth noting that this fidelity can be significantly increased. For example, it would be possible to model these bushfires as 3D meshes, growing and shrinking over time, moving through the bushland with a propagating fire front as well as hot and cold spots. In reality, this would likely be a necessary step in our design work and testing, however for the scope of this DME blog the simulation will operate with the simpler, uniform fires.
In particular, the optical payload will be assessed across a small and larger firer, each burning at a cooler and then a hotter temperature. Crucially, each of these design points can be compared between the pre and post-STOP analysis lens to ensure an accurate understanding of true system performance.
System Performance and Mission Success
Below, each of the design points is presented with the full simulated EOIR synthetic scene in Ansys STK.
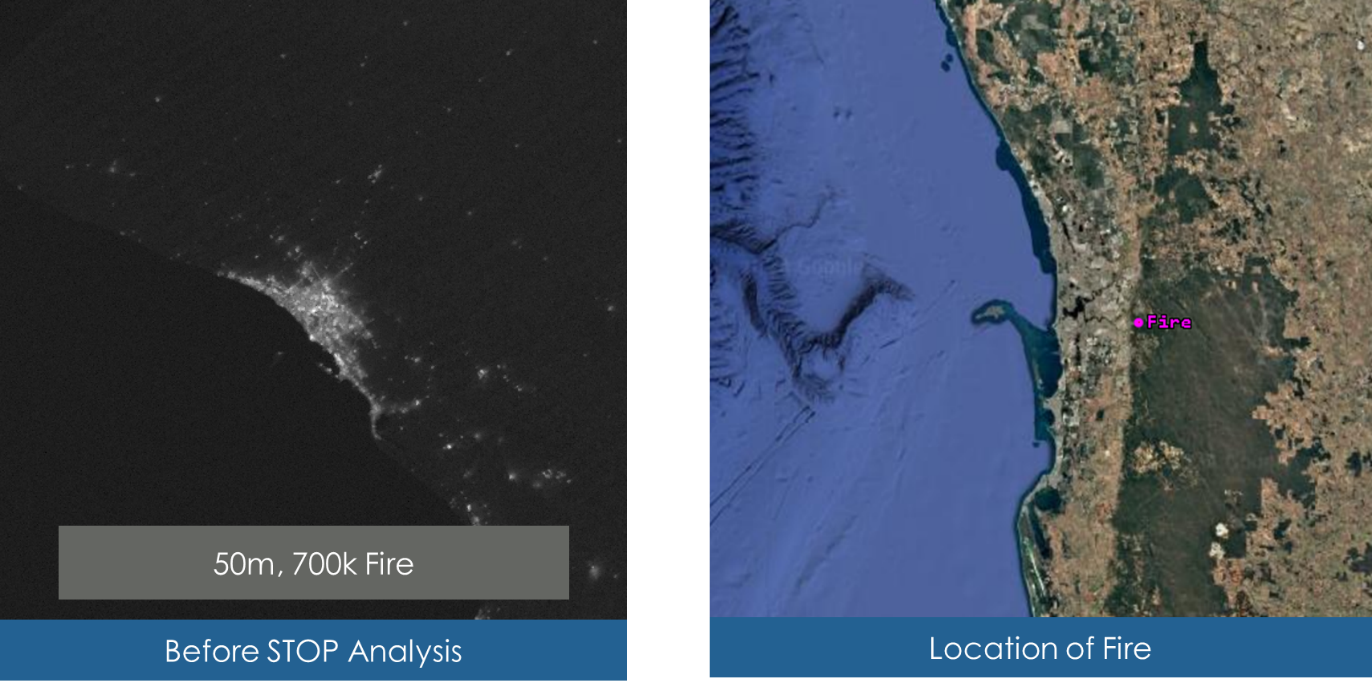
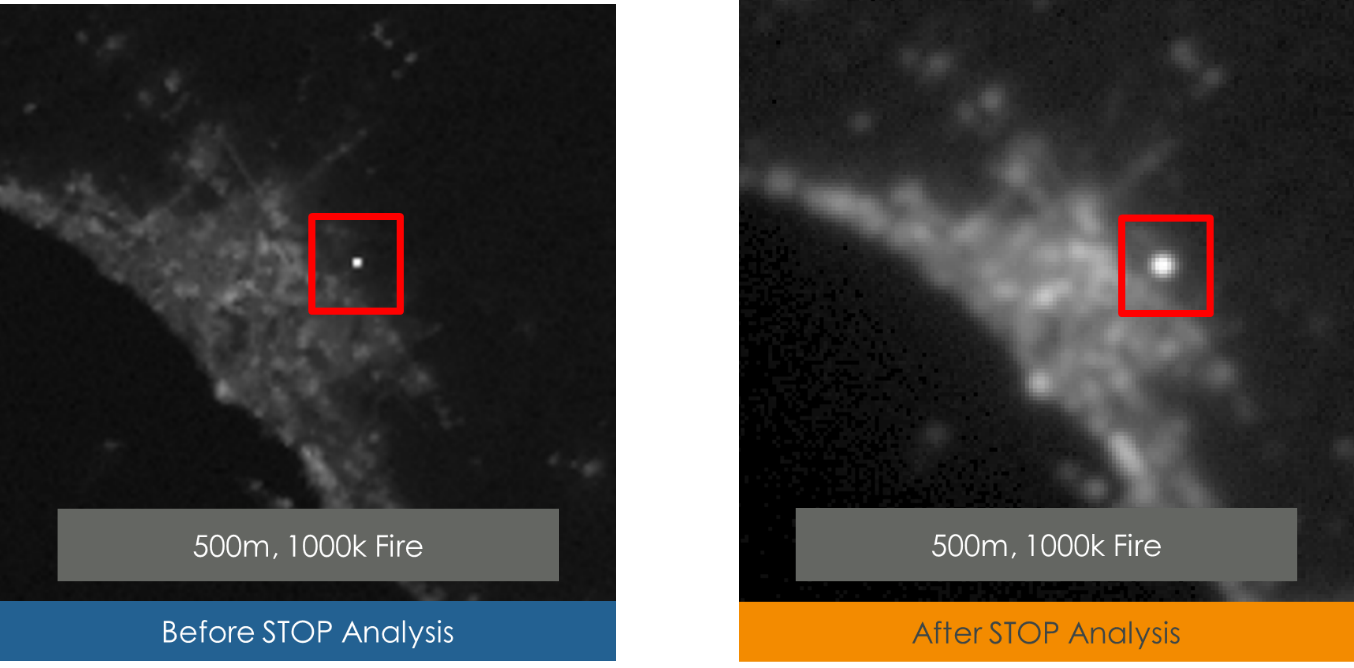
No visible detection of 700K fire, 1000K fire distinct detection when zoomed in.
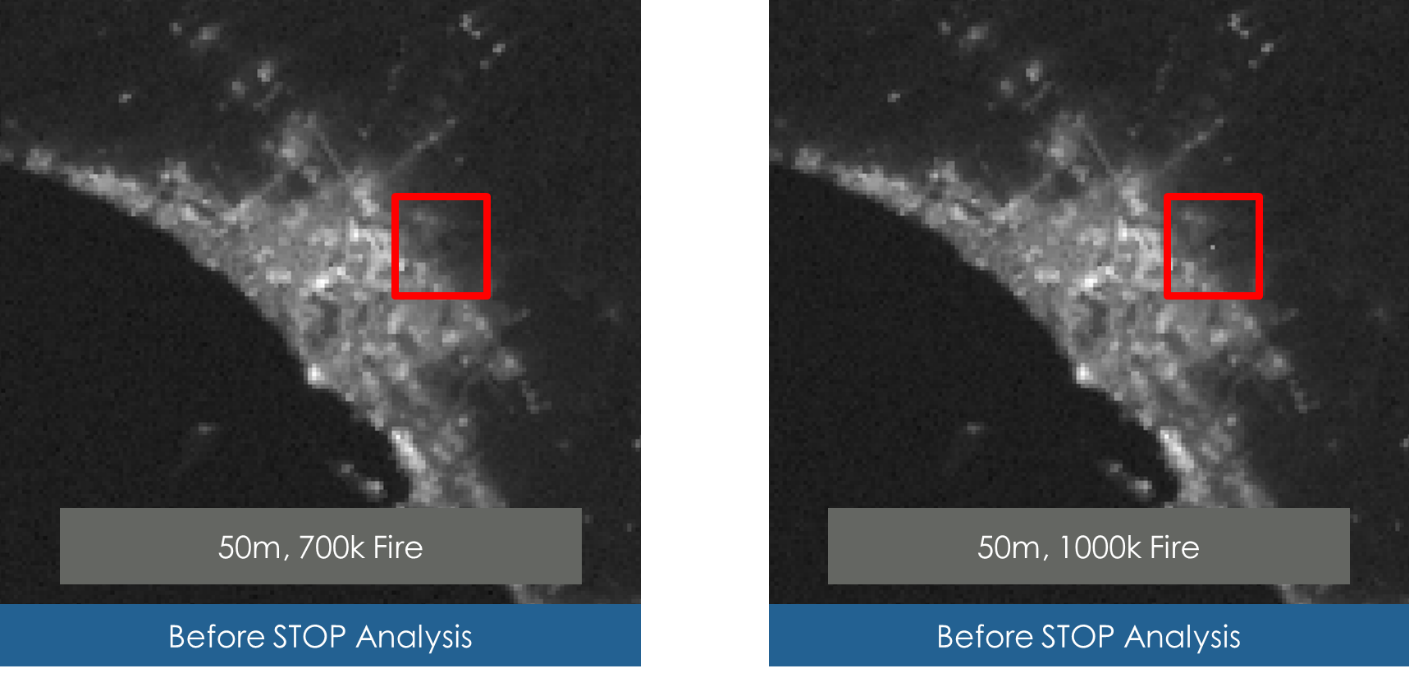
Although small, the 1000K Bushfire is clearly identifiable in the right-hand image above. Note image is cropped to show the small bright spot more clearly.
However, re-simulating that same scene with the post-STOP analysis lens performance reveals a much less certain bushfire detection.
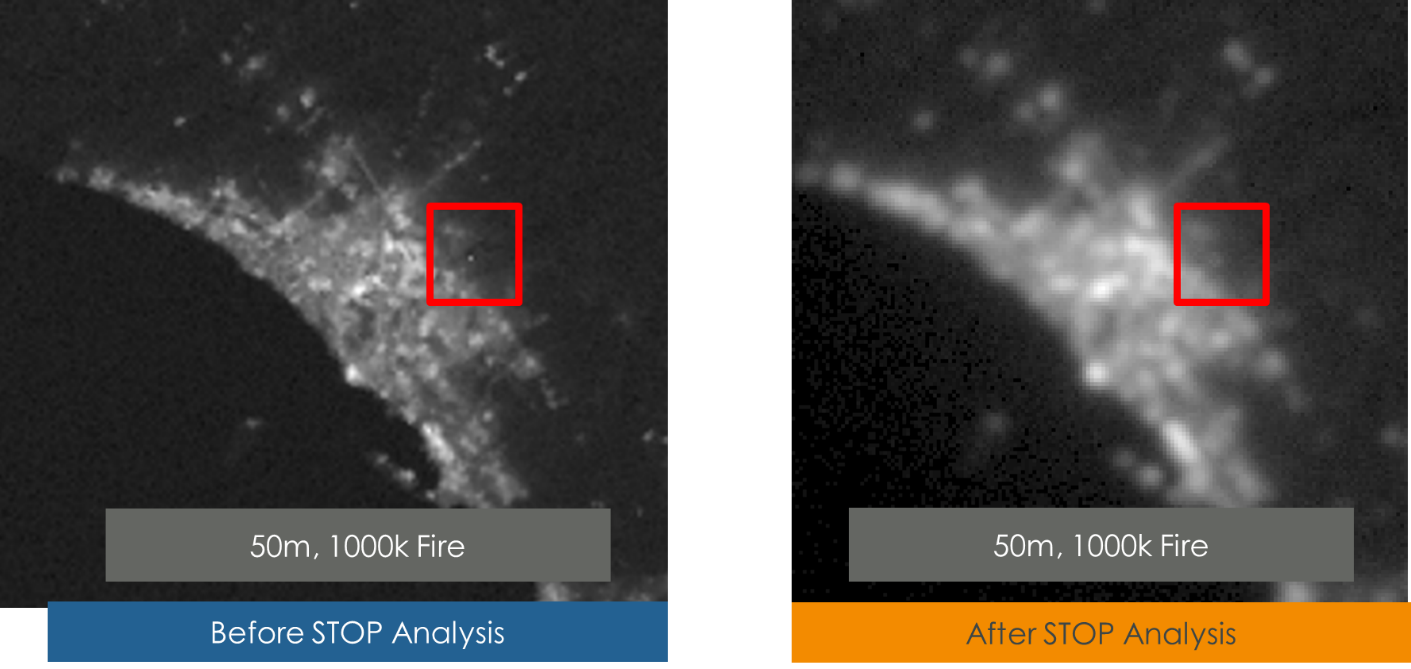
Bushfire is barely visible in the Post-STOP Analysis image, arguably only visible because we know its true location and where to look in the image.
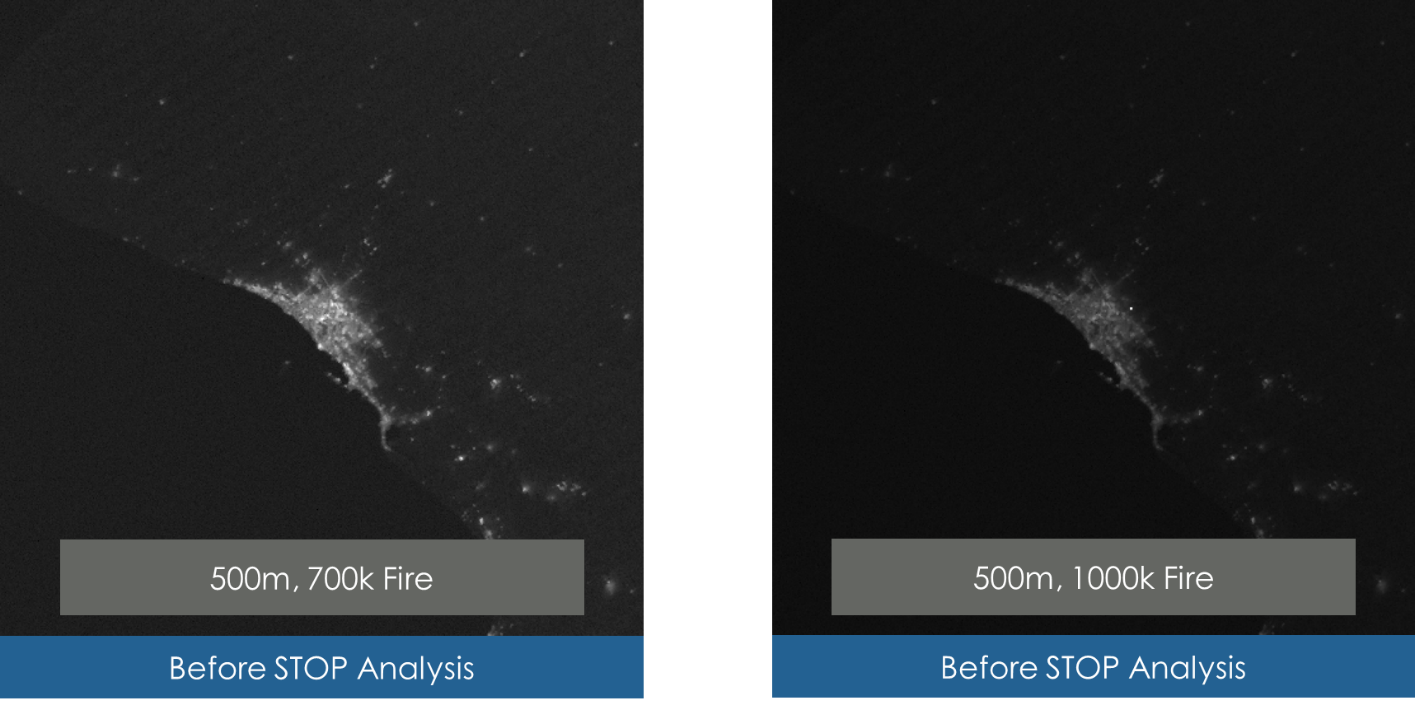
As was the case with the smaller fire, the 700K fire is not visible here. By comparison the hotter firer can be observed even without zooming in on the image.
Very visible. Newfound issue in that larger fire is now bleeding into neighbouring pixels, making it difficult to discern its true size.
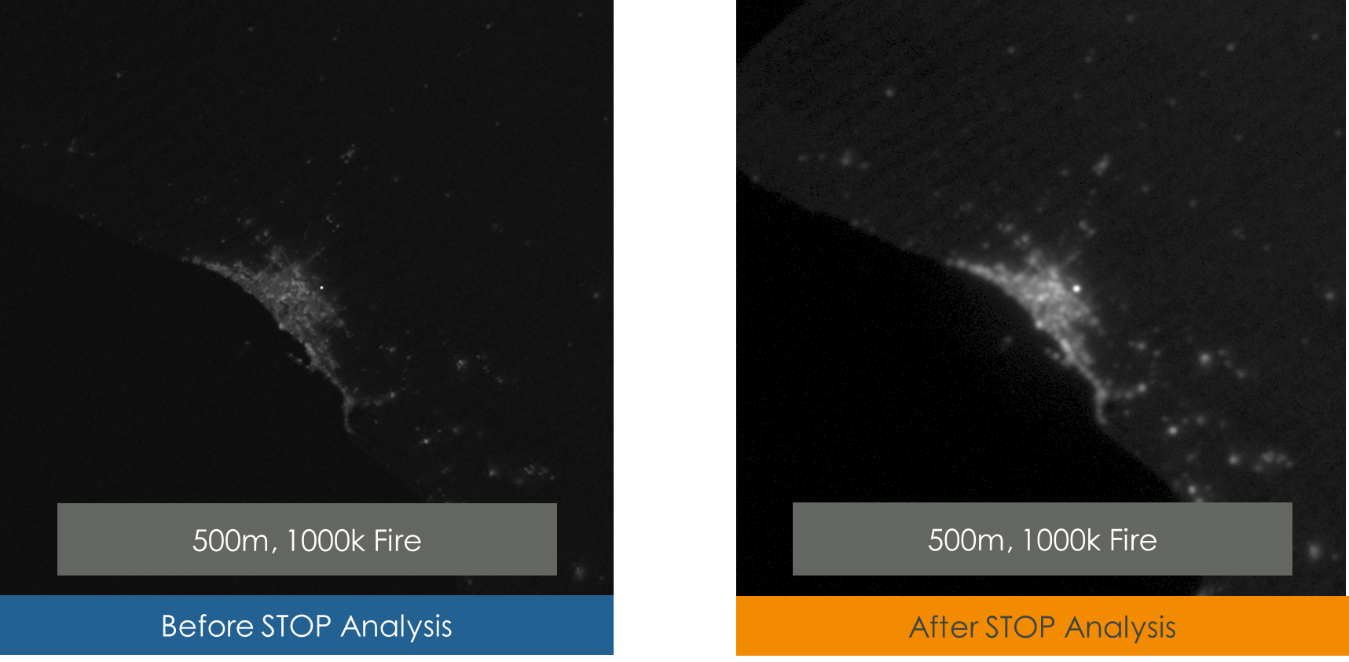
Zoomed in, the above image clearly shows the “bleeding” of the bushfire in the post-STOP Analysis result, thus making it difficult to discern the fires true size.
Summary
The ability to quickly and easily explore potential scenarios with new targets is invaluable in evaluating the overall system effectiveness. With these examples we can see that our current sensor configuration is only able to detect the higher temperature fires, and detection of smaller fires may be difficult if surrounded by other bright spots. This analysis also visualises the impact of lens degradation after our STOP analysis, allowing us to make a more informed decision about whether this system is fit for purpose, or requires further design work to produce a clearer image.
As with the initial stop Analysis, the digital thread established with these simulations now facilitates the rapid exploration and testing of any number of design changes, targeting scenarios or changing mission requirements. Ultimately, providing a robust workflow with which we can reduce risk and increase confidence in the system, and ensuring the design is fit for purpose before launch day rolls around.
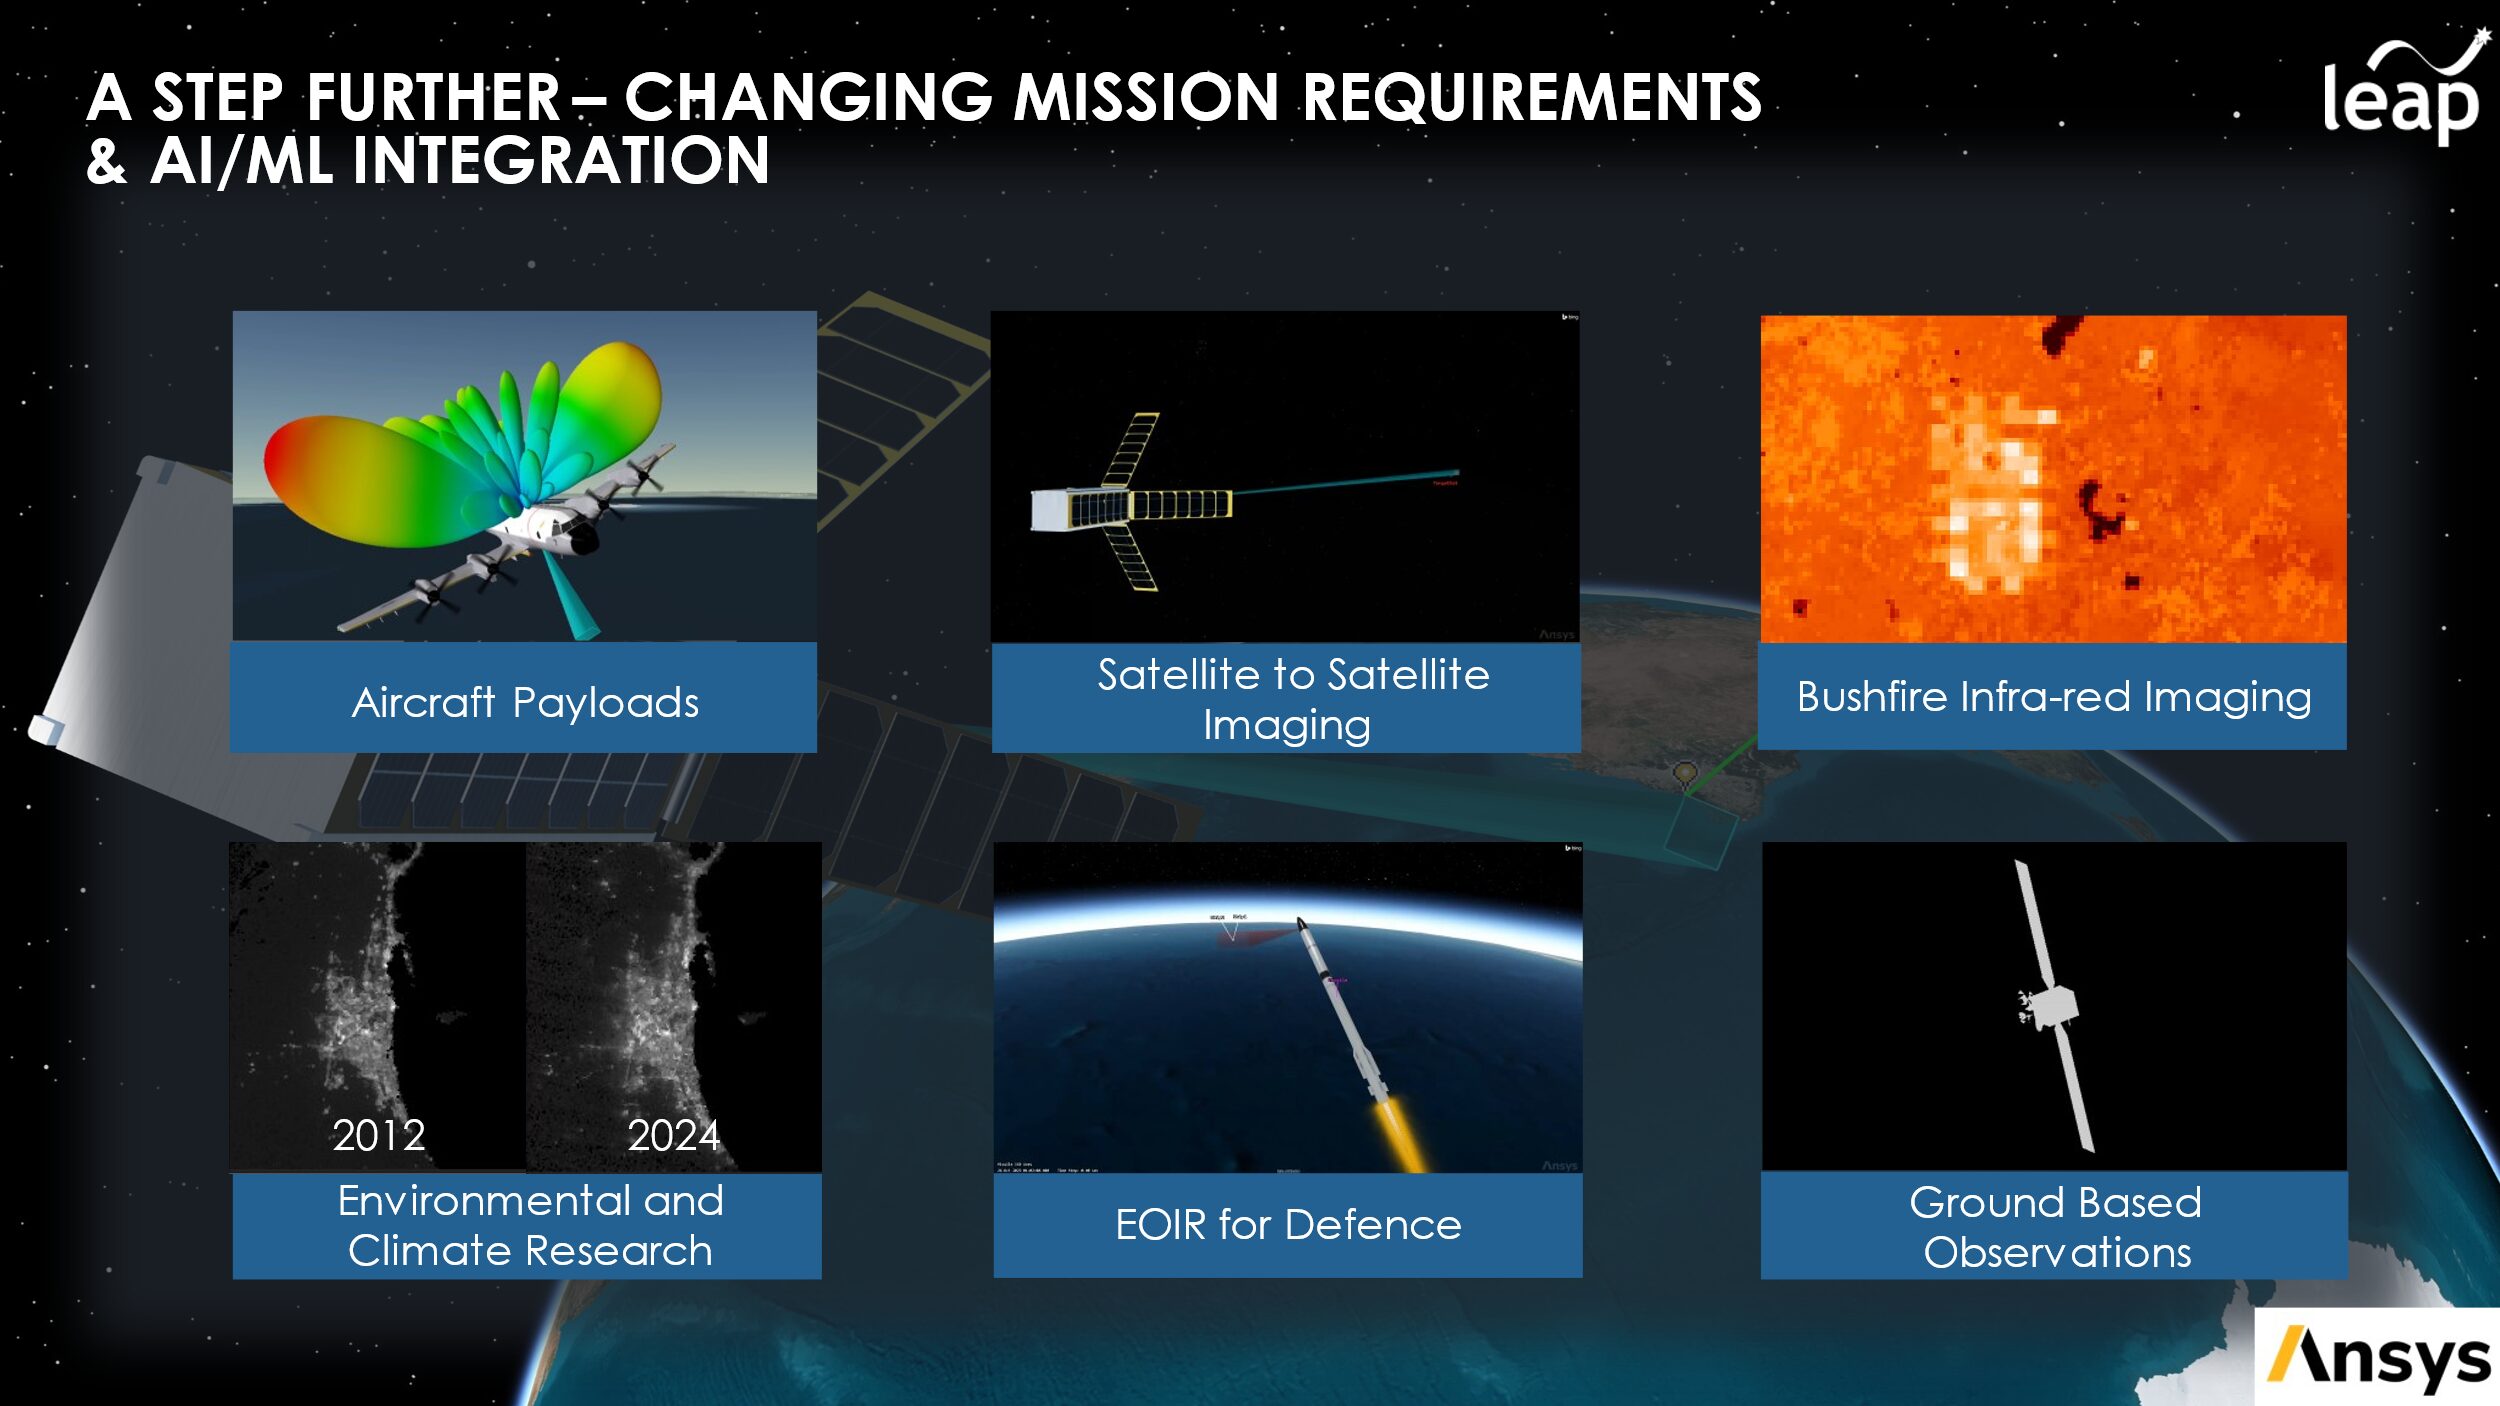
A few other use cases, changing mission requirements and various design choices that could now be rapidly evaluated with the digital thread of simulation established with this STOP Analysis.
Be sure to check out the other content on our new Digital Mission Engineering Blog, if you have any questions about this STOP analysis, or other applications of this technology please feel free to reach out to us at any time.
References
|
[1] |
K. L. Y. K. a. S. H. Jin, “Optical Design of a Reflecting Telescope for a CubeSat,” Journal of the Optical Society of Korea, vol. 17, no. 6, pp. 533-537, 2013. |
|
[2] |
Google, “Map of Perth and surrounds,” November 2024. [Online]. Available: https://maps.app.goo.gl/F9qNiaeiXgkzpKUf6 . [Accessed November 2024]. |
|
[3] |
Google, “Map of Sydney and Surrounds,” November 2024. [Online]. Available: https://maps.app.goo.gl/vGqefa5J2SAFA6Kv5 . [Accessed November 2024]. |
|
[4] |
A. Inc, “Simulating Realistic Optical Performance of a Low Earth Orbit Satellite,” 2023. |
|
[5] |
Google, Data SIO, NOAA, U.S. Navy, NGA, GEBCO, Landsat/Copernicus, IBCAO, U.S. Geological Survey, “3D Terrain Data,” 2024. [Online]. [Accessed November 2024]. |
|
[6] |
NASA, “VIIRS/NPP Gap-Filled Lunar BRDF-Adjusted Nighttime Lights Daily L3 Global 500m Linear Lat Lon Grid [Dataset],” 2019. [Online]. Available: https://doi.org/10.5067/VIIRS/VNP46A2.001. [Accessed December 2024]. |